Fig. 5
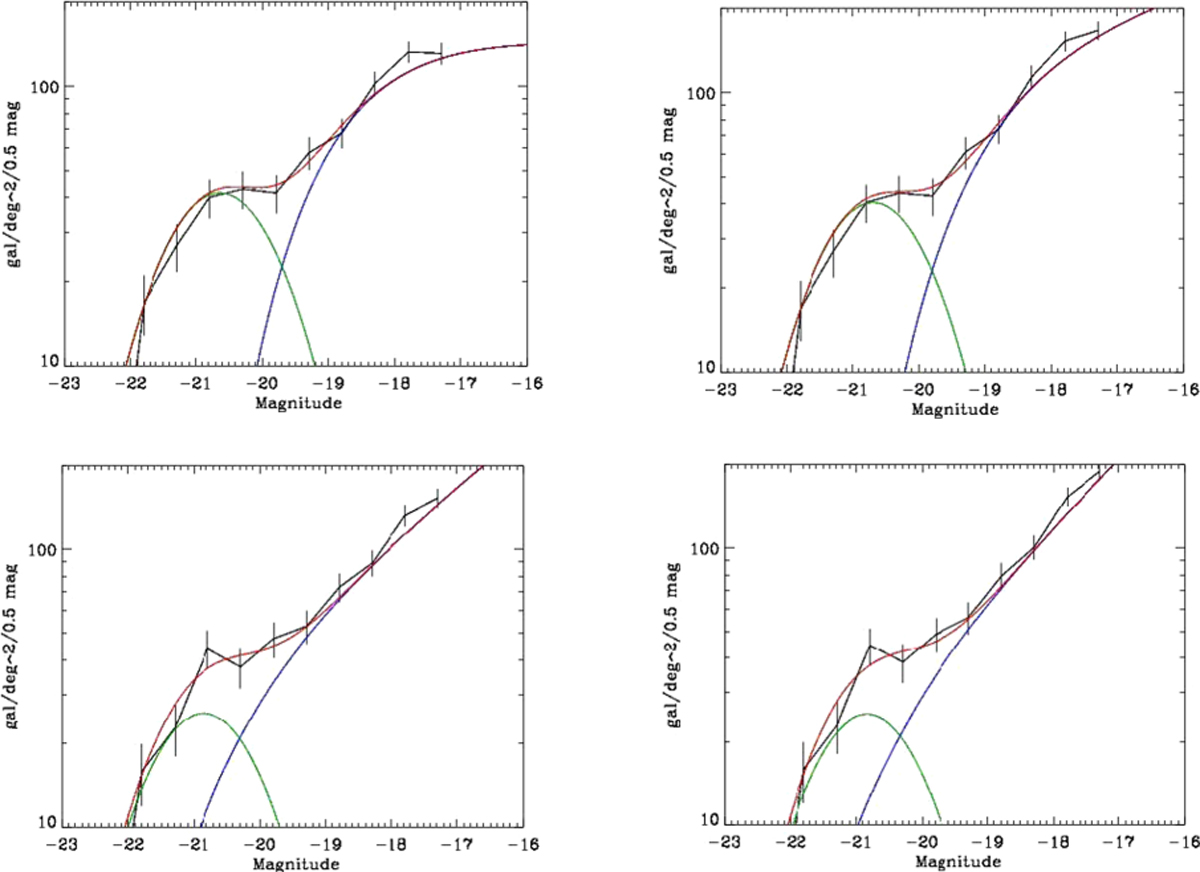
Galaxy luminosity function of the Ophiuchus cluster in the entire MegaCam field. The black line and points are the data, the green curve is the Gaussian component, the blue curve is the Schechter function, and the red curve is the total of the two components. Top: constant galactic extinctioncorrection of 1.357, bottom: individual galactic extinction correction. Left: subtraction of Yasuda background counts, and right: subtraction of Yasuda background counts multiplied by f = 0.7 (see Sect. 3.1).
Current usage metrics show cumulative count of Article Views (full-text article views including HTML views, PDF and ePub downloads, according to the available data) and Abstracts Views on Vision4Press platform.
Data correspond to usage on the plateform after 2015. The current usage metrics is available 48-96 hours after online publication and is updated daily on week days.
Initial download of the metrics may take a while.