Fig. 4
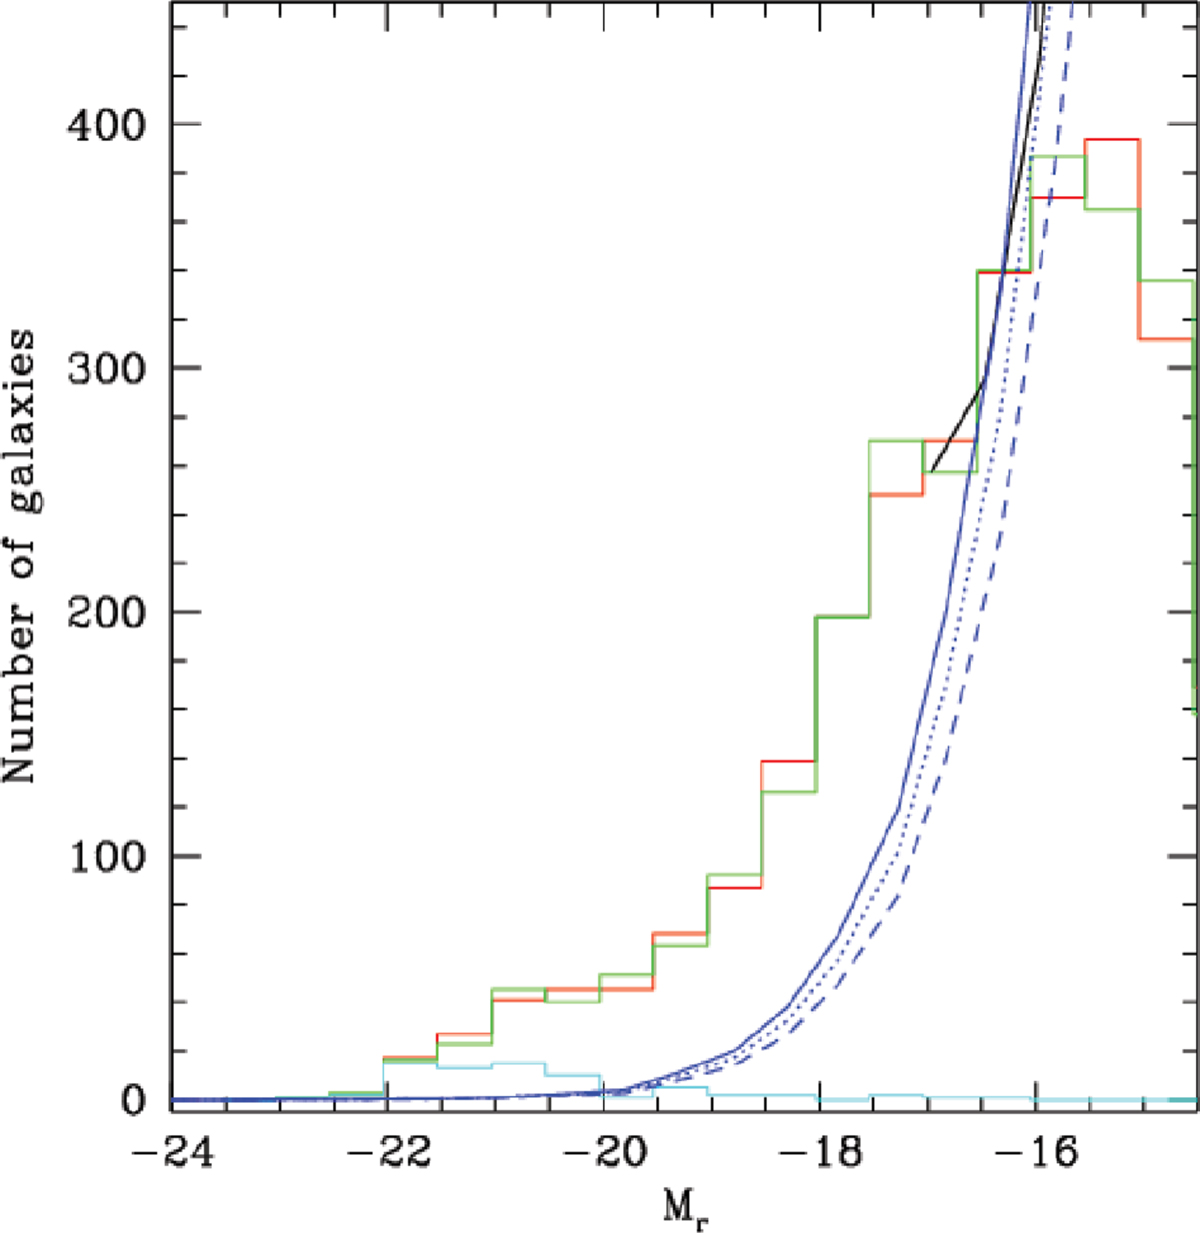
Galaxy counts in the r′ band converted to absolute magnitude (see text). The red histogram shows the 2818 galaxies from our catalogue and the cyan histogram those with spectroscopic redshifts in the cluster range, both corrected for a constant galactic extinction of 1.357 as explained in Sect. 2. The green histogram shows the 2818 galaxies from our catalogue corrected for their individual galactic extinction. The blue and black lines show the field galaxy counts computed by Yasuda et al. (2001), and McCracken et al. (2003) respectively. The blue dotted and dashed lines show the Yasuda background counts multiplied by 0.85 and 0.70, respectively (see Sect. 3.1).
Current usage metrics show cumulative count of Article Views (full-text article views including HTML views, PDF and ePub downloads, according to the available data) and Abstracts Views on Vision4Press platform.
Data correspond to usage on the plateform after 2015. The current usage metrics is available 48-96 hours after online publication and is updated daily on week days.
Initial download of the metrics may take a while.