Fig. 4
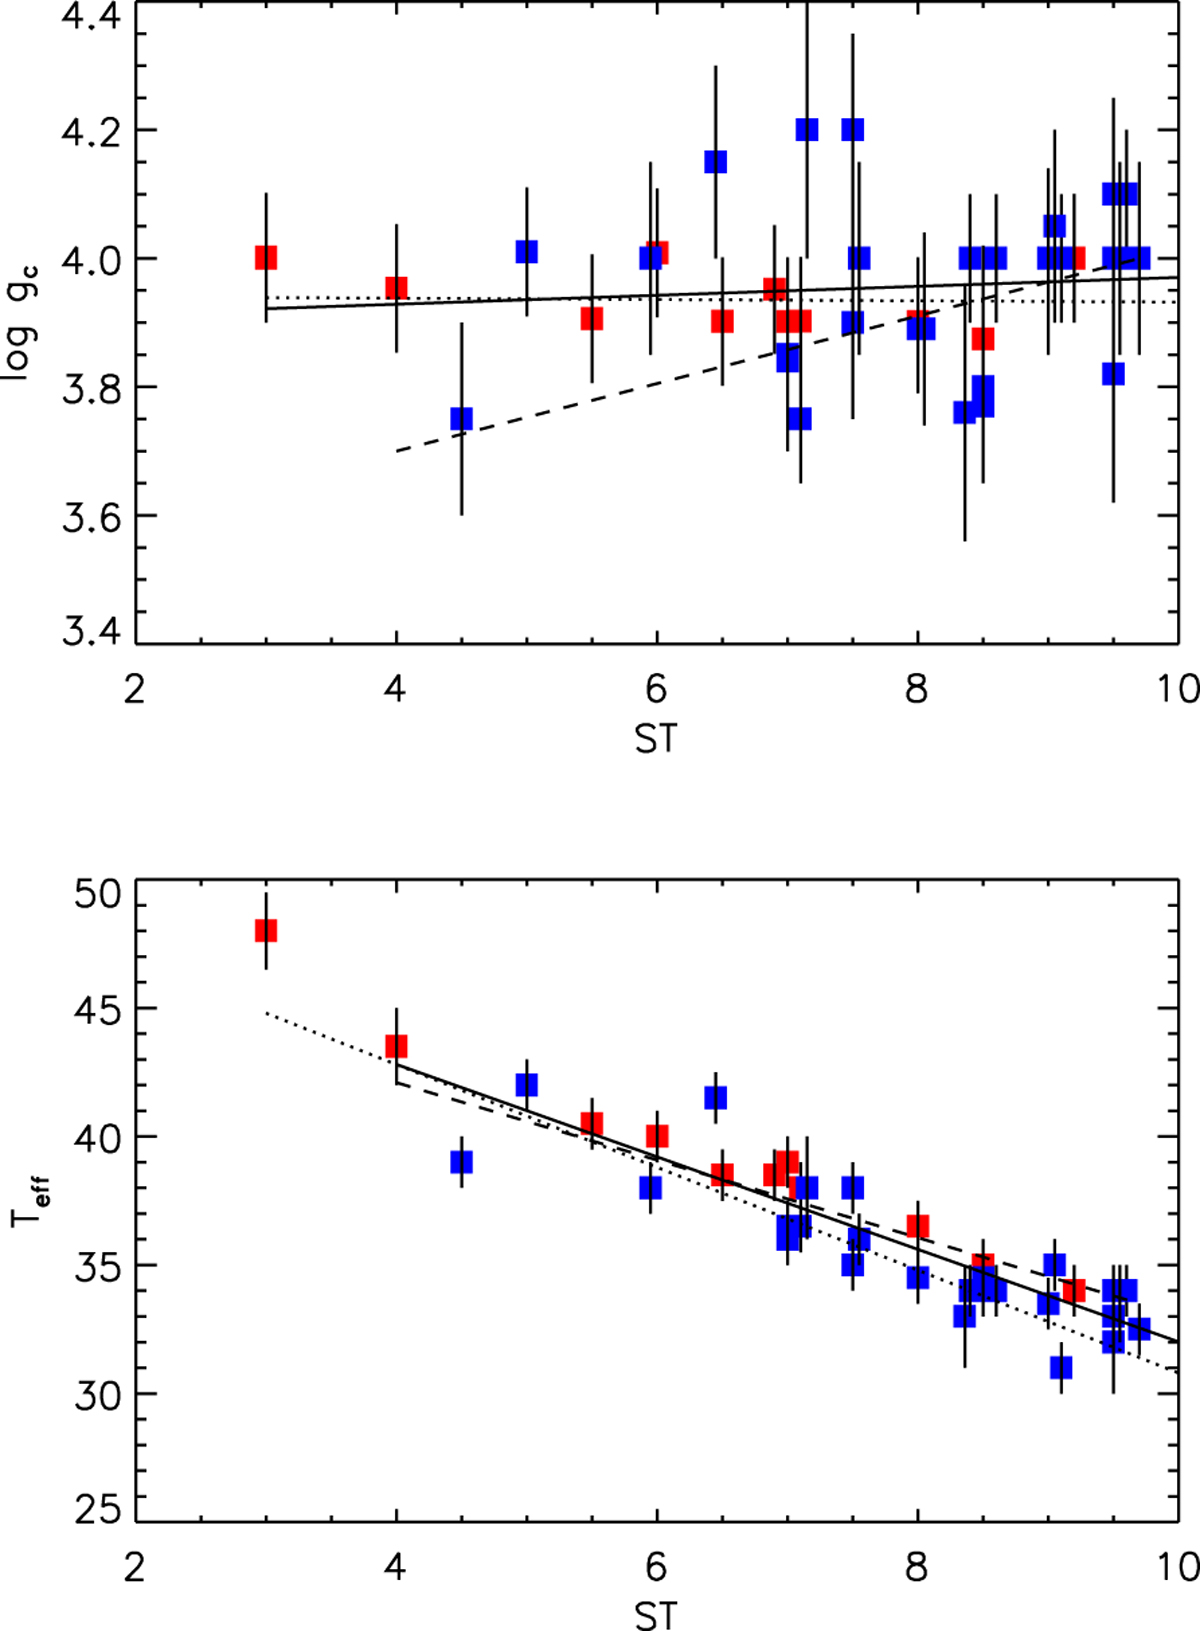
ST– log gc and ST–Teff relations for the extended dwarf sample (see text). The FASTWIND targets (present study) are highlighted in red, and objects analysed by means of CMFGEN in blue. The solid line provides the least-squares fit for the complete sample. Dotted and dashed linesdenote callibrations by Martin and the regression obtained by Simón-Díaz et al. (2014), respectively.
Current usage metrics show cumulative count of Article Views (full-text article views including HTML views, PDF and ePub downloads, according to the available data) and Abstracts Views on Vision4Press platform.
Data correspond to usage on the plateform after 2015. The current usage metrics is available 48-96 hours after online publication and is updated daily on week days.
Initial download of the metrics may take a while.