Fig. 8
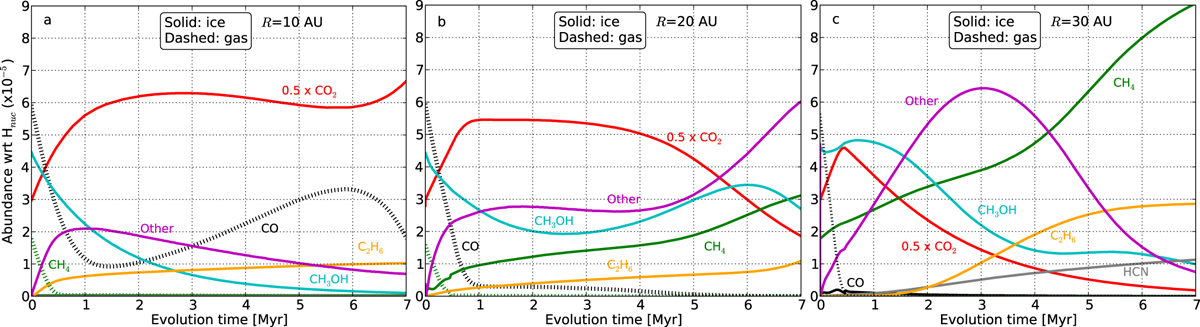
Time evolution of the main volatile species at 10, 20 and 30 AU, plotted on linear scales to ease comparison to Fig. 7 of Yu et al. (2016) and Fig. 2 of Yu et al. (2017). The H2O ice abundance in these plots is at least 80. A rapid decrease of gaseous CO is seen within 1 Myr. The CO2 ice is plotted at half its abundance to emphasize the steep drop for CO gas before 1 Myr at all three radii.
Current usage metrics show cumulative count of Article Views (full-text article views including HTML views, PDF and ePub downloads, according to the available data) and Abstracts Views on Vision4Press platform.
Data correspond to usage on the plateform after 2015. The current usage metrics is available 48-96 hours after online publication and is updated daily on week days.
Initial download of the metrics may take a while.