Fig. 3
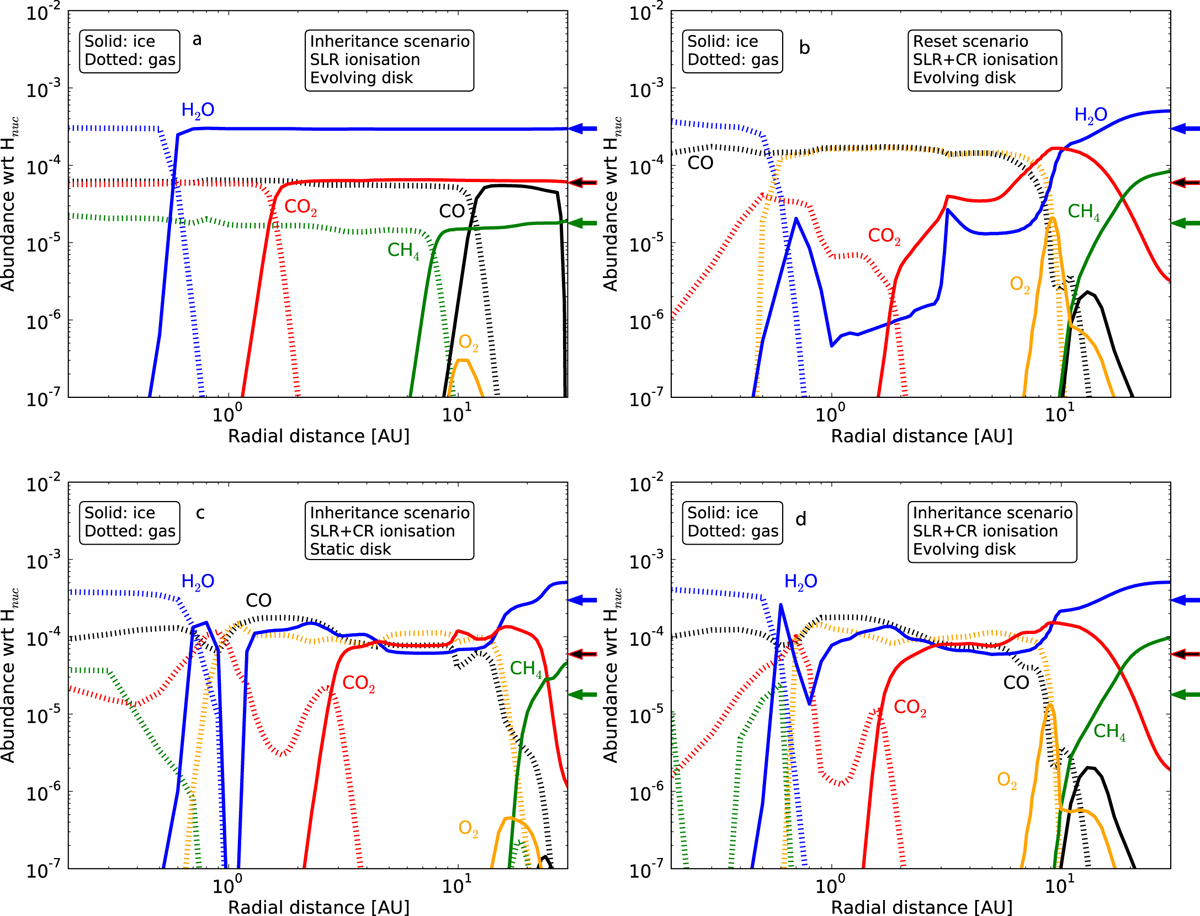
Abundances after 7 Myr evolution for four different model setups. Panel a: inheritance scenario with low ionisation and evolving disk structure. Panel b: reset scenario, high ionisation and evolving disk structure. Panel c: inheritance scenario with high ionisation and static (unchanging) disk structure. Panel d: inheritance scenario with high ionisation and evolving disk structure. The blue, red-and-black and green arrows to the right of each panel indicate the initial abundances assumed for H2O, CO/CO2 and CH4, respectively, in the inheritance scenario.
Current usage metrics show cumulative count of Article Views (full-text article views including HTML views, PDF and ePub downloads, according to the available data) and Abstracts Views on Vision4Press platform.
Data correspond to usage on the plateform after 2015. The current usage metrics is available 48-96 hours after online publication and is updated daily on week days.
Initial download of the metrics may take a while.