Fig. 1
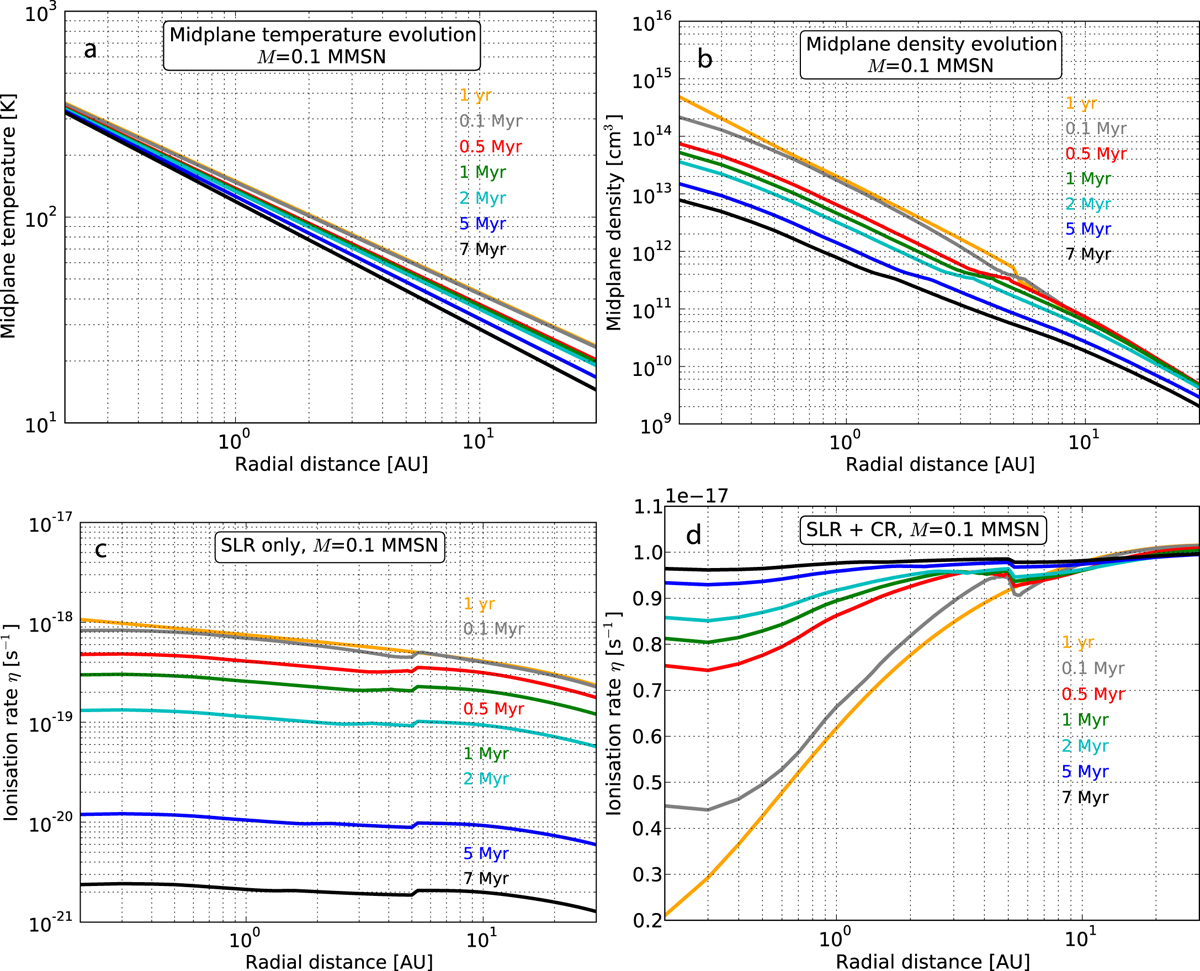
Midplane temperature and density (top) and ionisation rates (bottom) as functions of disk radius for different evolutionary times for the 0.1 MMSN evolving disk model. For this model, the starting conditions at 1 yr are given by the orange profiles shown here, which feature slightly different physical conditions than that for the static disk structure adopted by Paper I (see text for details).
Current usage metrics show cumulative count of Article Views (full-text article views including HTML views, PDF and ePub downloads, according to the available data) and Abstracts Views on Vision4Press platform.
Data correspond to usage on the plateform after 2015. The current usage metrics is available 48-96 hours after online publication and is updated daily on week days.
Initial download of the metrics may take a while.