Fig. 3
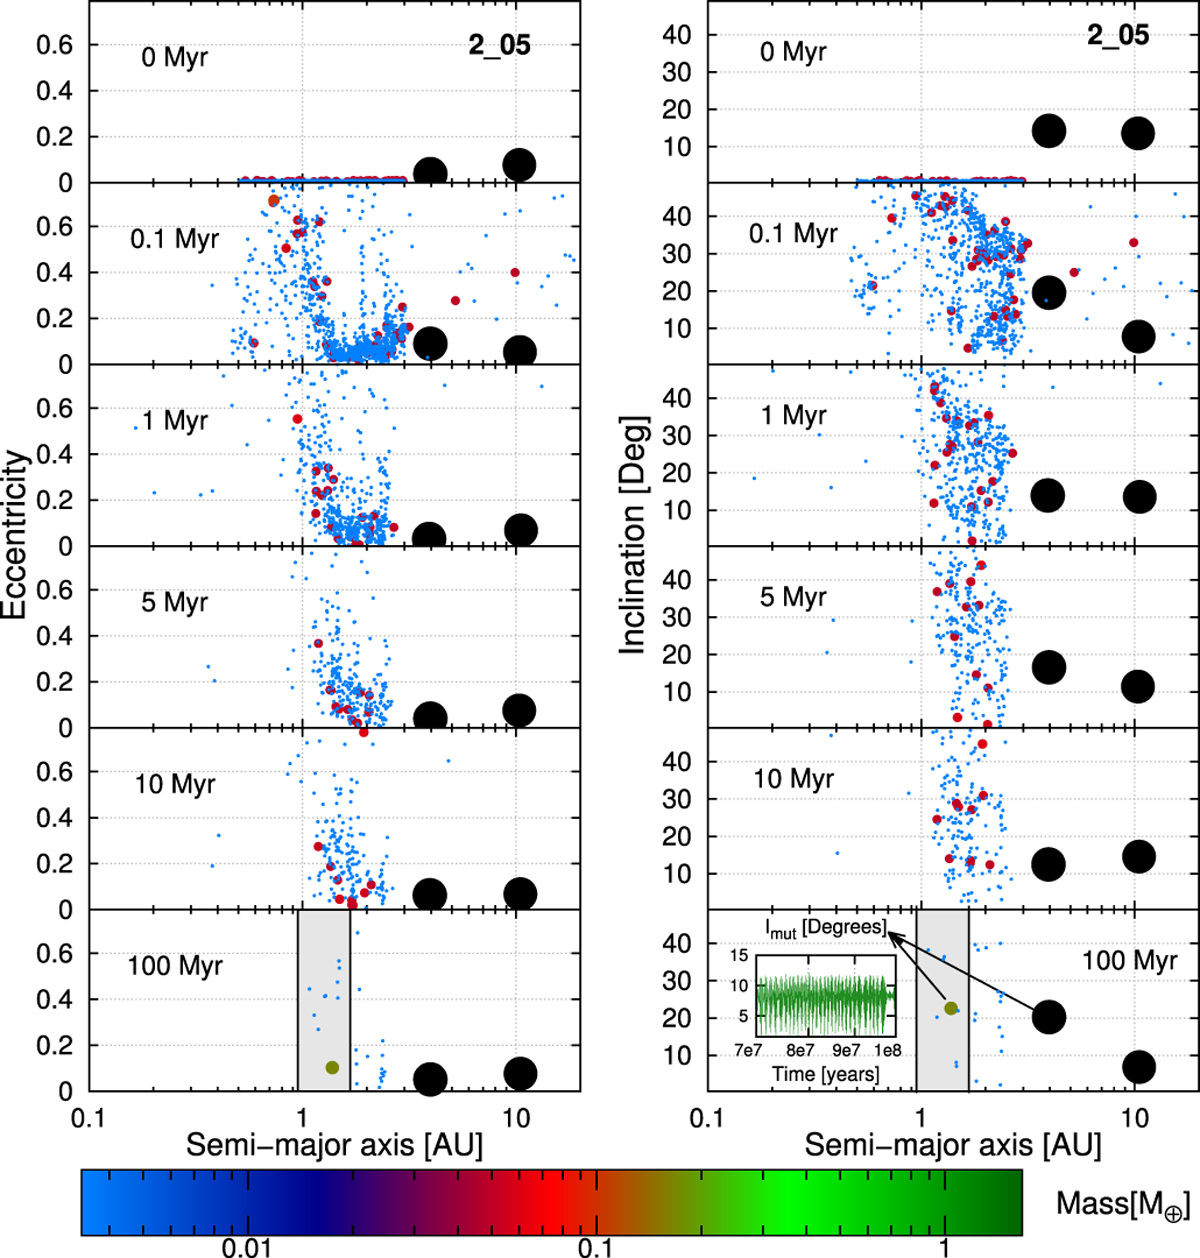
Snapshots in time from a non-coplanar system (3D-POP, 2_05) with Imut ≈ 30° initially. Evolution of the eccentricities is shown on the left, and the inclinations on the right. The size of each circle is proportional to the cubic root of its mass (see also the colourbar). The giant planets are displayed with black circles. The light grey shaded region corresponds to the habitable zone. The evolution of the mutual inclination between the inner giant and the largest terrestrial body in the last 30 Myr is shown in the inset plot.
Current usage metrics show cumulative count of Article Views (full-text article views including HTML views, PDF and ePub downloads, according to the available data) and Abstracts Views on Vision4Press platform.
Data correspond to usage on the plateform after 2015. The current usage metrics is available 48-96 hours after online publication and is updated daily on week days.
Initial download of the metrics may take a while.