Fig. 15
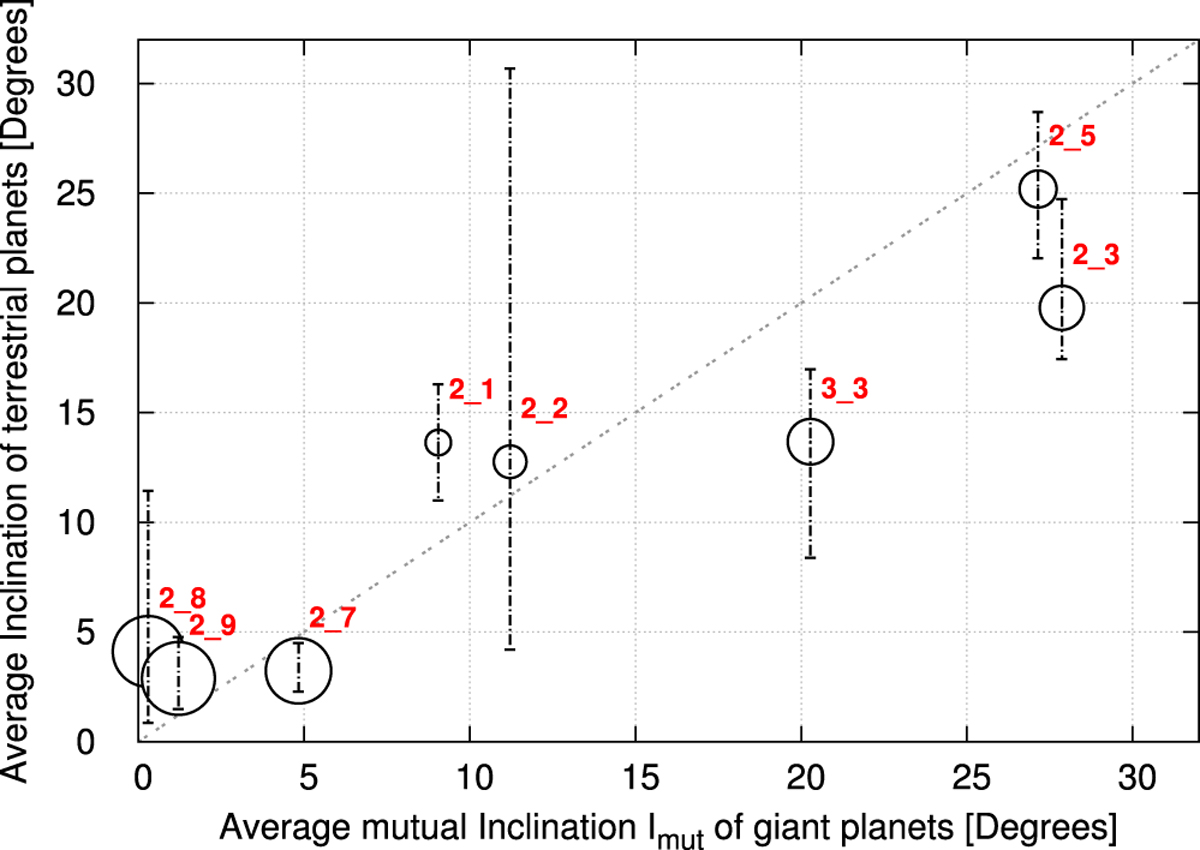
Average inclination (with respect to the initial midplane of the disc) of all the terrestrial planets formed in two-planet systems. The horizontal axis shows the average mutual inclination between the two giants. The average values are computed over the last 10 Myr of integration. For each configuration, the vertical error bars show the maximum and minimum inclinations of the terrestrial planets. The size of each circle corresponds to the largest planet found in a configuration and is proportional to the cubic root of the planetary mass.
Current usage metrics show cumulative count of Article Views (full-text article views including HTML views, PDF and ePub downloads, according to the available data) and Abstracts Views on Vision4Press platform.
Data correspond to usage on the plateform after 2015. The current usage metrics is available 48-96 hours after online publication and is updated daily on week days.
Initial download of the metrics may take a while.