Fig. 7
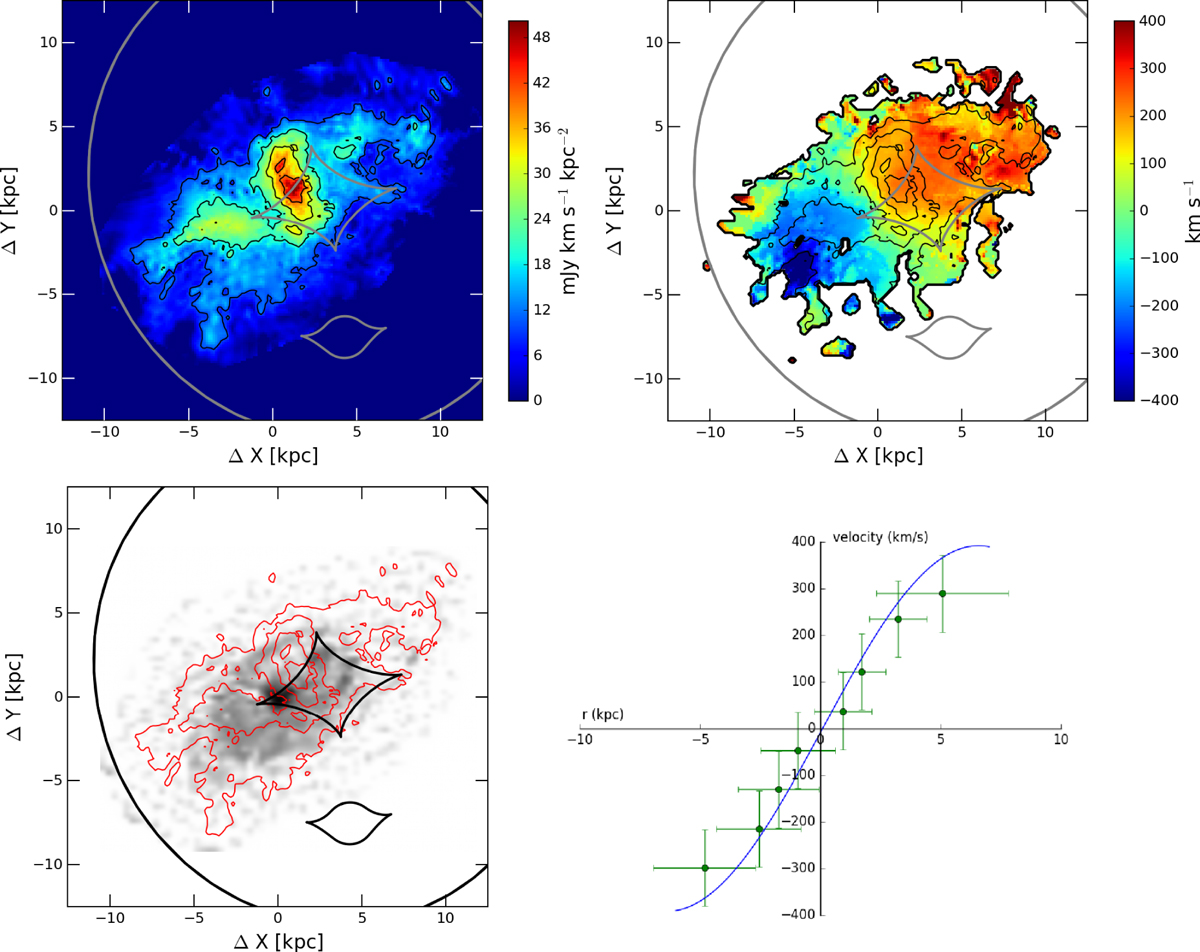
Upper-left: Moment-zero (integrated line intensity, in units of mJy km s−1 kpc−2). Upper-right: Moment-one (velocity field, in units of km s−1). For the moment-one map, only regions with a signal-to-noise ratio > 1 are taken into account. The thin black lines trace the 25, 50 and 75 per cent contours of the moment-zero peak intensity. The coordinate system is centred on the AGN position obtained from the HST imaging (Suyu et al. 2013). Lower-left: Overlay of the reconstructed CO (2-1) moment-zero map (red contours) on the optical continuum image (grey scale, Suyu et al. 2013). The source-plane caustics are shown as solid grey lines. Lower-right: One-dimensional rotation curve of the reconstructed CO (2-1) source, displaying a shape typical for disk-like dynamics. The blue solid line represents the rotation curve, corrected for disk inclination of i = 54°.
Current usage metrics show cumulative count of Article Views (full-text article views including HTML views, PDF and ePub downloads, according to the available data) and Abstracts Views on Vision4Press platform.
Data correspond to usage on the plateform after 2015. The current usage metrics is available 48-96 hours after online publication and is updated daily on week days.
Initial download of the metrics may take a while.