Fig. 6
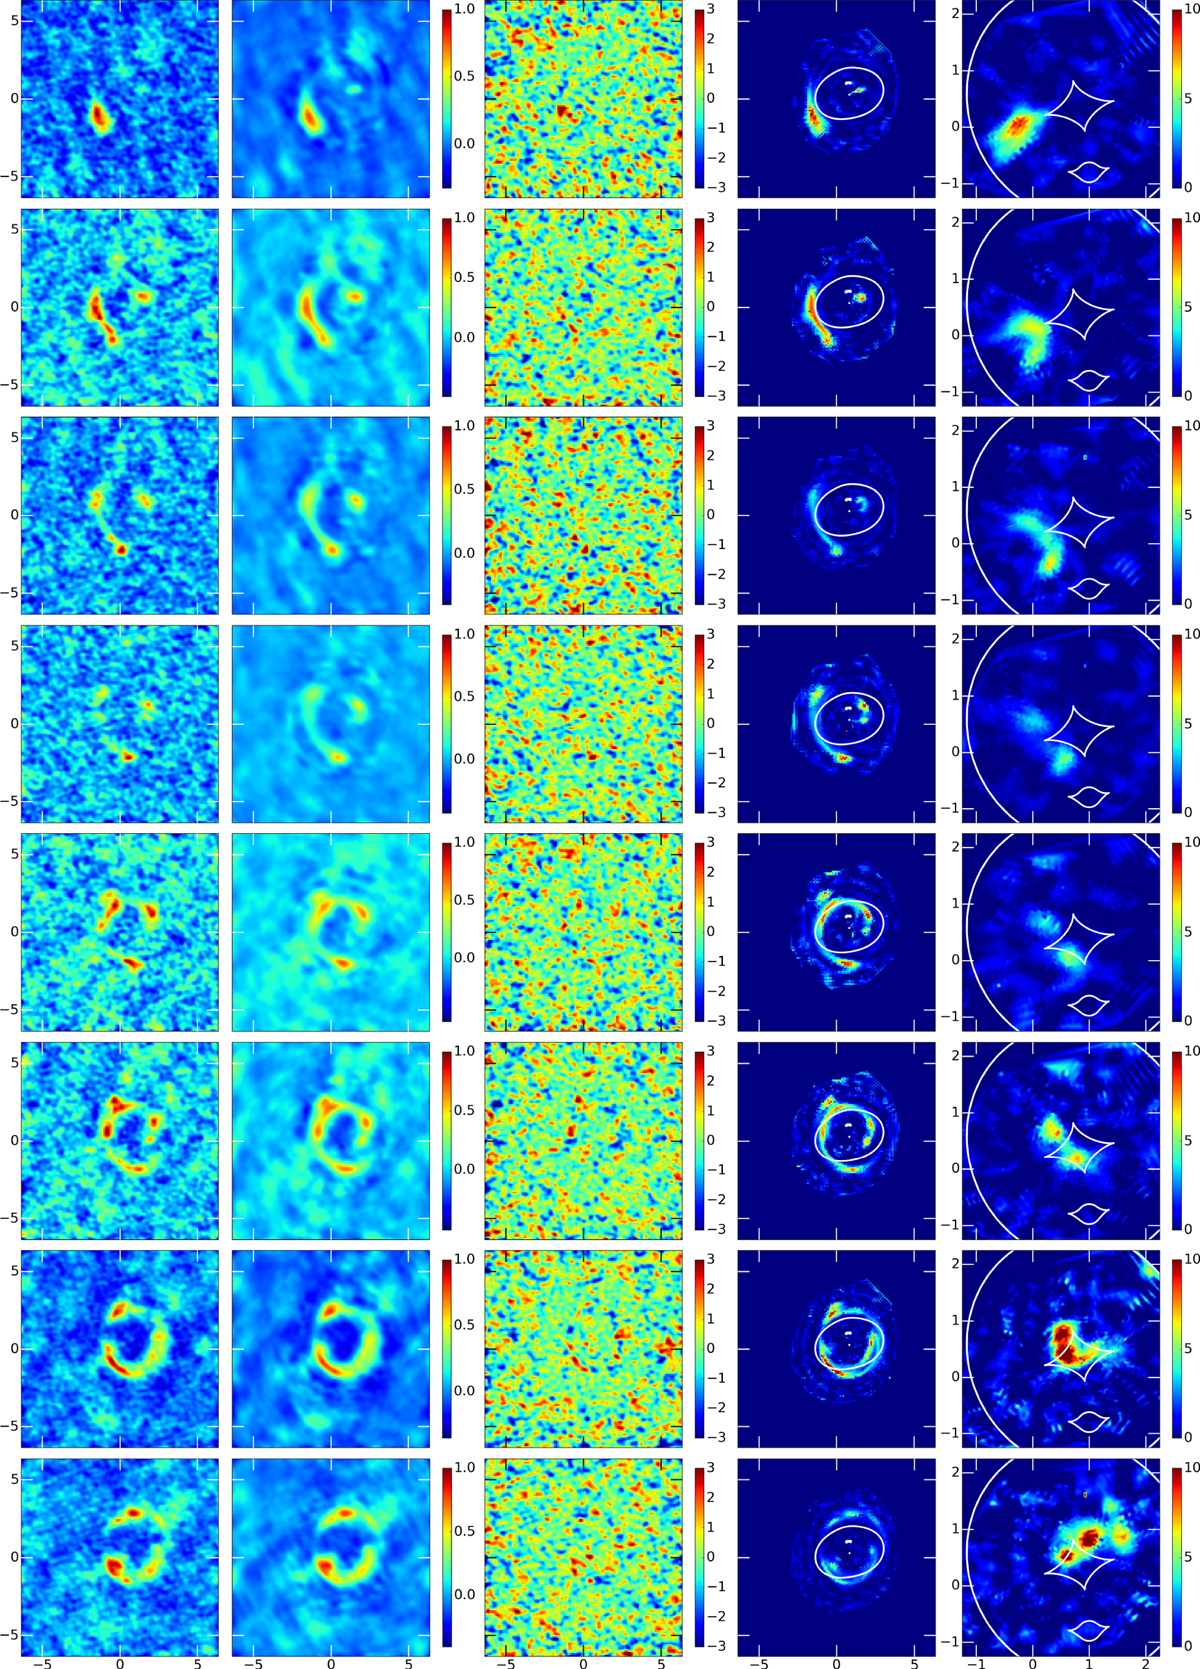
Reconstruction of the CO (2-1) emission for our 8 velocity channels. From left to right are shown the dirty image of the data, the dirty image of the best model (normalised to the peak of the dirty image data), the residuals of the data-model, the best image-plane model and the best source-plane model (in units of mJy km s−1 arcsec2). The white lines denote the critical lines and caustics in the image plane and the source plane, respectively. The axis coordinates are in arcsec with respect to the ALMA phase-tracking centre. The spatial scale in the source plane (right panels) is 1′′ = 7.030 kpc.
Current usage metrics show cumulative count of Article Views (full-text article views including HTML views, PDF and ePub downloads, according to the available data) and Abstracts Views on Vision4Press platform.
Data correspond to usage on the plateform after 2015. The current usage metrics is available 48-96 hours after online publication and is updated daily on week days.
Initial download of the metrics may take a while.