Fig. 5
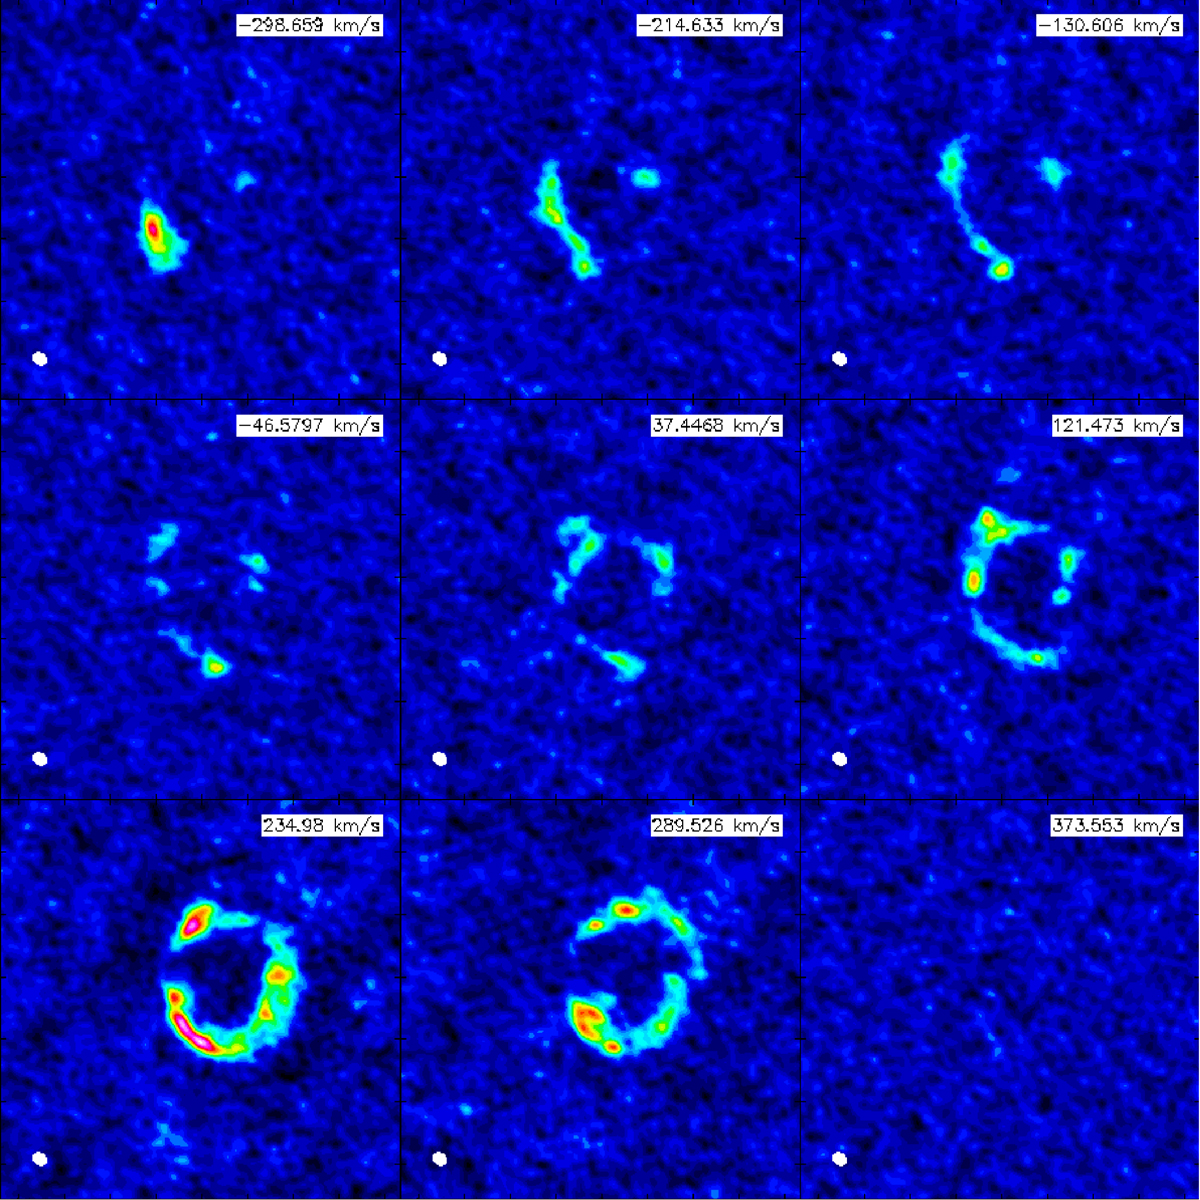
Channel maps (82 km s−1 width) for the CO (2-1) emission line from about − 300 to + 400 km s−1, relative to the systemic velocity. The maps show the clear velocity dependent structure of the line surface brightness distribution. Each map covers a sky area of 12.8′′ ×12.8′′ and the linear intensity-scale ranges from − 0.04 to 0.2 Jy beam−1 km s−1. The systemic velocity corresponds to a redshift of z = 0.654, and is in the LSRK frame using the radio definition of the redshift. The synthesised beam has a size of 0.44 × 0.36′′ at a position angle of 60 degrees east of north, and is shown in the bottom left-hand corner of each map as the white ellipse.
Current usage metrics show cumulative count of Article Views (full-text article views including HTML views, PDF and ePub downloads, according to the available data) and Abstracts Views on Vision4Press platform.
Data correspond to usage on the plateform after 2015. The current usage metrics is available 48-96 hours after online publication and is updated daily on week days.
Initial download of the metrics may take a while.