Fig. 5
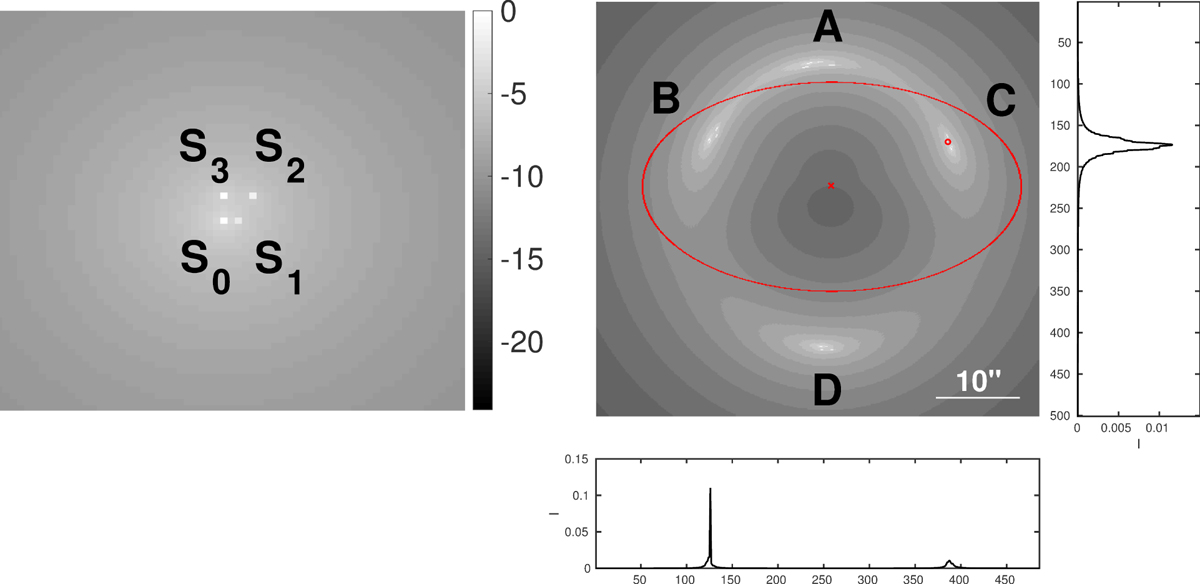
Logarithmic intensity distribution of a source consisting of four Sérsic profiles, described in Sect. 4.1, simulating a galaxy with resolved brightness features (left). Multiple images of this source generated by the SIE lens introduced in Wagner (2017) and described in Sect. 4.2 (right). The lens centre is indicated by a red cross; the small red circle marks the point through which the horizontal and vertical intensity profiles run (shown beneath andto the right of the picture).
Current usage metrics show cumulative count of Article Views (full-text article views including HTML views, PDF and ePub downloads, according to the available data) and Abstracts Views on Vision4Press platform.
Data correspond to usage on the plateform after 2015. The current usage metrics is available 48-96 hours after online publication and is updated daily on week days.
Initial download of the metrics may take a while.