Fig. 12
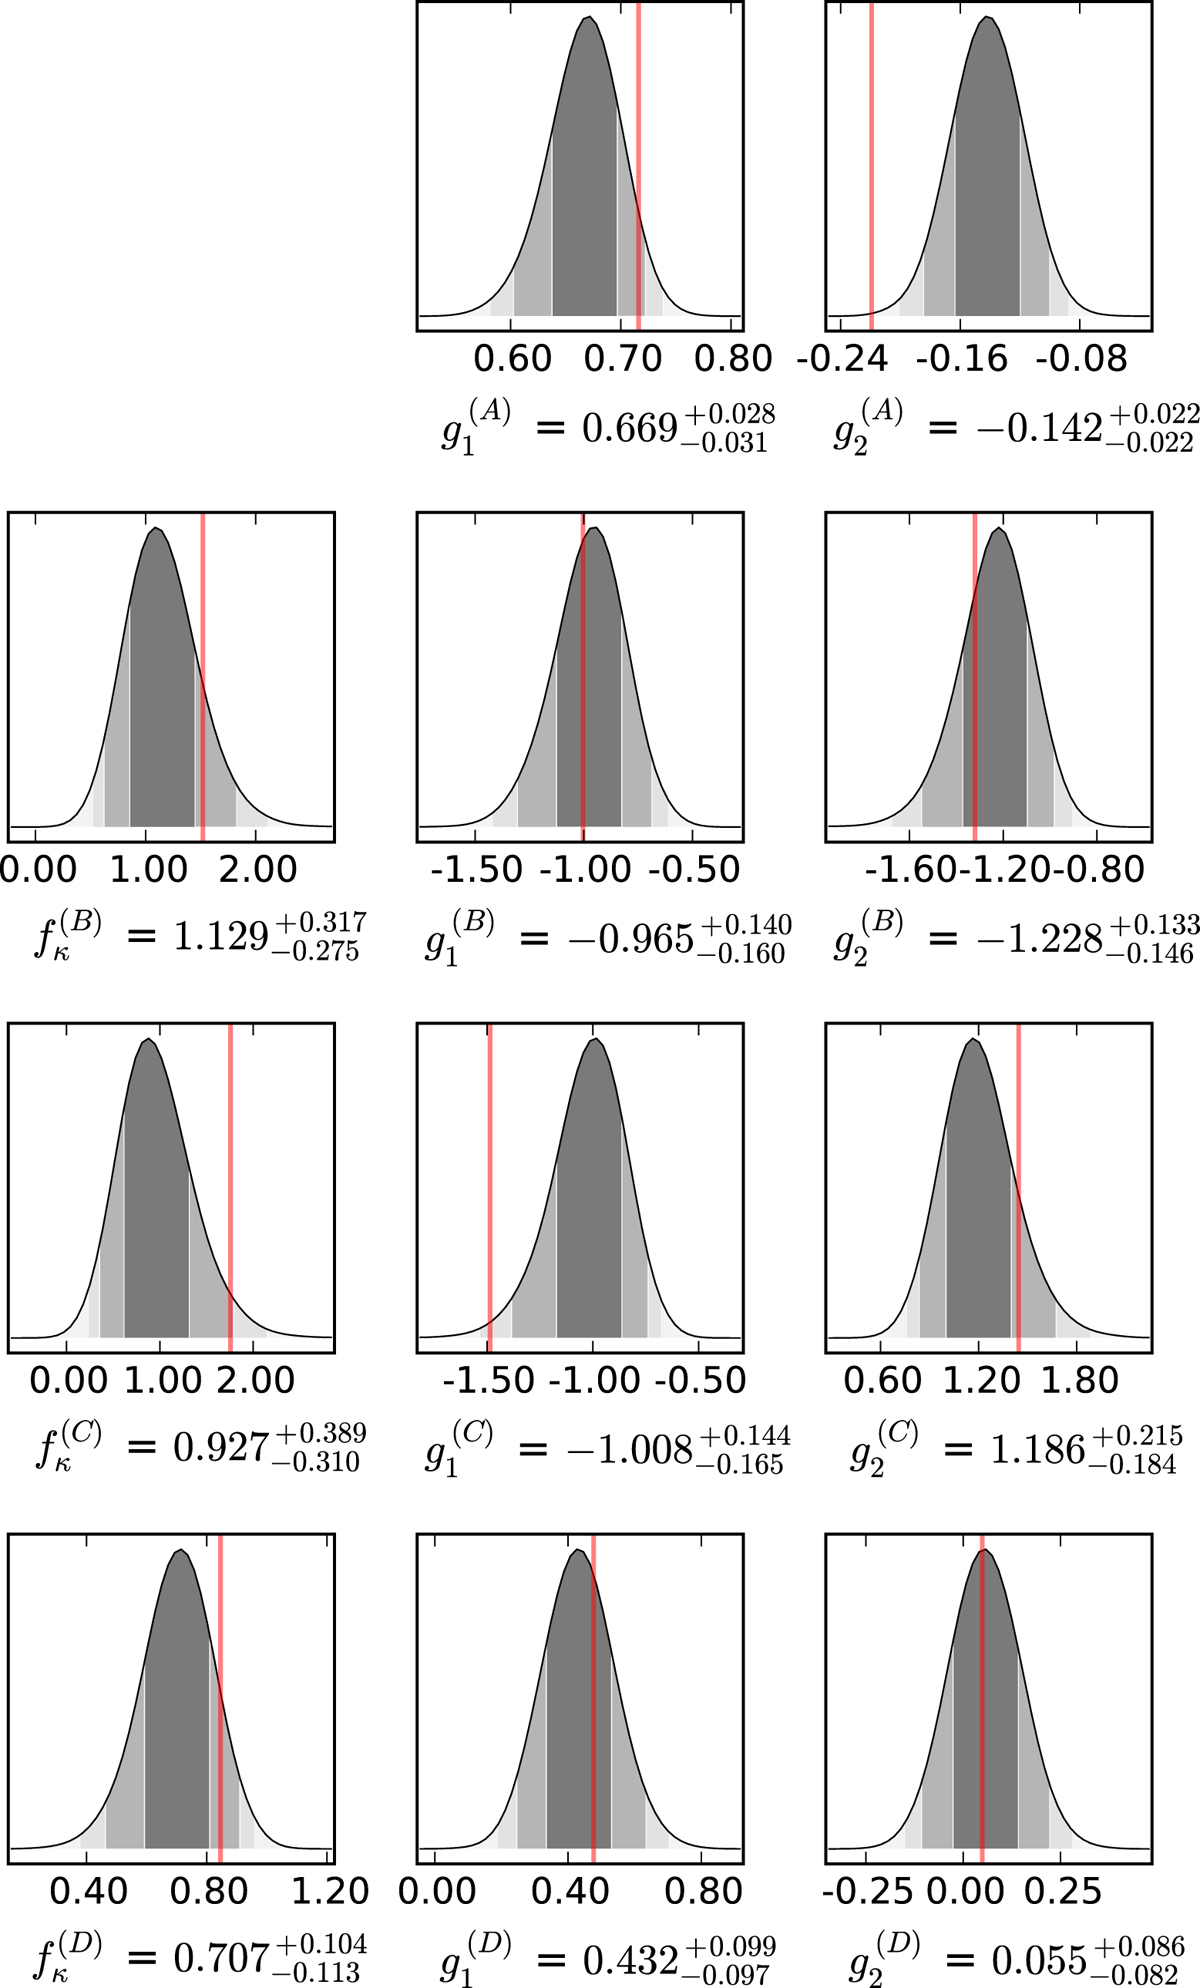
Comparison of the probability density distributions of the convergence ratios fκ and reduced shear components gi, i = 1, 2 of the SIE lens at the centres of light of the four multiple images of the second source with their true values (red lines). The dark grey shaded area, the grey shaded area, and the light grey shaded area delimit the 1-, 2-, and 3-σ confidence intervals, respectively.
Current usage metrics show cumulative count of Article Views (full-text article views including HTML views, PDF and ePub downloads, according to the available data) and Abstracts Views on Vision4Press platform.
Data correspond to usage on the plateform after 2015. The current usage metrics is available 48-96 hours after online publication and is updated daily on week days.
Initial download of the metrics may take a while.