Fig. 10
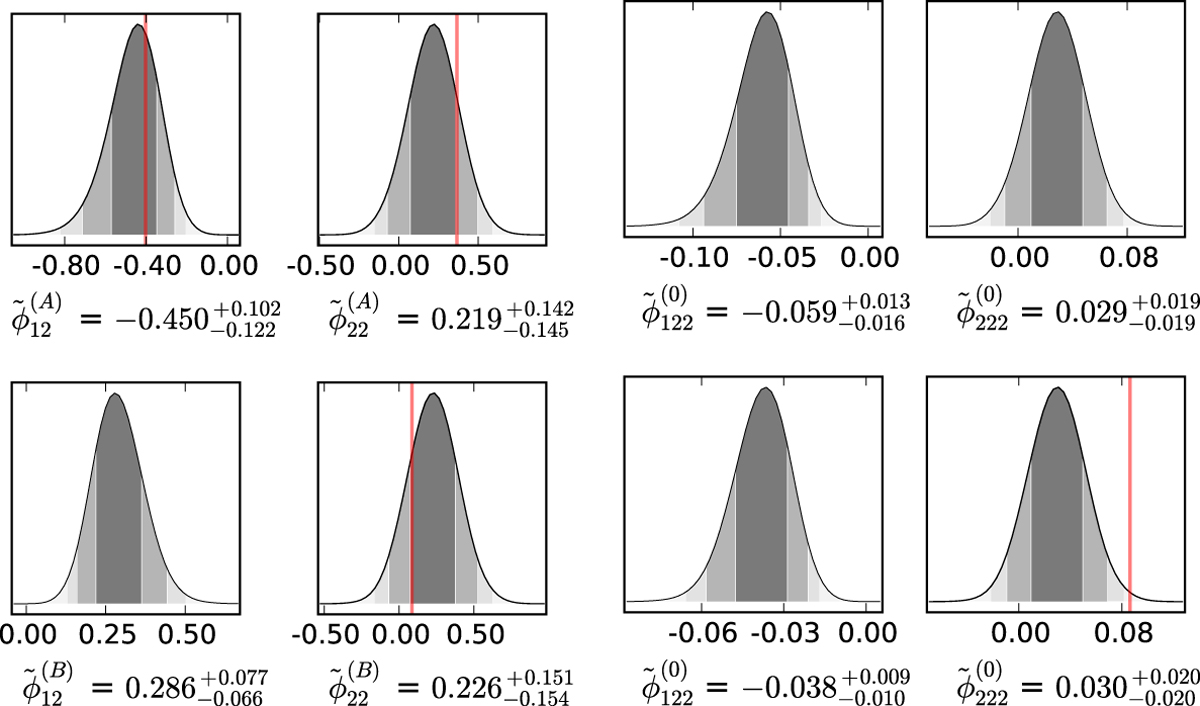
Comparison of the true ratios of potential derivatives (red lines) at a fold with the probability density distributions of the ratios of potential derivatives determined by our approach using the quadrupole moment as observable instead of the transformation matrix. The first row of the last two columns uses image A and the bottom row uses image B for the reconstruction of the third-order potential derivatives.
Current usage metrics show cumulative count of Article Views (full-text article views including HTML views, PDF and ePub downloads, according to the available data) and Abstracts Views on Vision4Press platform.
Data correspond to usage on the plateform after 2015. The current usage metrics is available 48-96 hours after online publication and is updated daily on week days.
Initial download of the metrics may take a while.