Free Access
Fig. 4
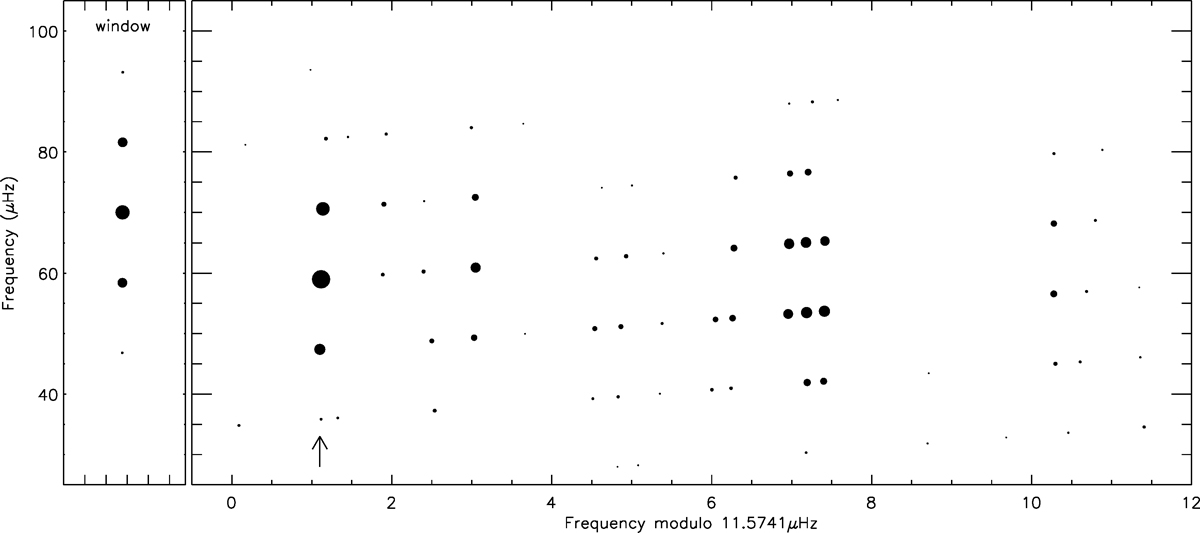
Échelle diagram with respect to the daily alias 11.57 μHz, which brings out peaks belonging to the window function. This is the basis for locating a number of possible modes listed in Table 2. The arrow points to the five peaks corresponding to the dominant mode in the power spectrum.
Current usage metrics show cumulative count of Article Views (full-text article views including HTML views, PDF and ePub downloads, according to the available data) and Abstracts Views on Vision4Press platform.
Data correspond to usage on the plateform after 2015. The current usage metrics is available 48-96 hours after online publication and is updated daily on week days.
Initial download of the metrics may take a while.