Free Access
Fig. D.3
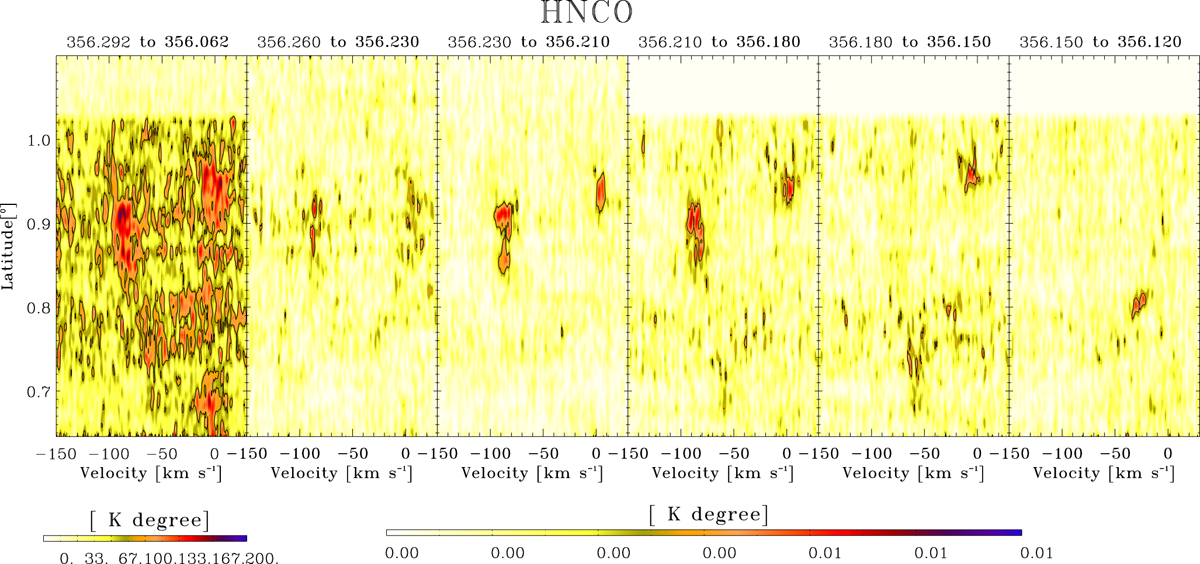
Latitude-velocity maps of the HNCO emission integrated in the complete longitude range from 356°.29165 to 356°.06249 (left panel), and in longitude steps of 108′′ (subsequent panels).
Current usage metrics show cumulative count of Article Views (full-text article views including HTML views, PDF and ePub downloads, according to the available data) and Abstracts Views on Vision4Press platform.
Data correspond to usage on the plateform after 2015. The current usage metrics is available 48-96 hours after online publication and is updated daily on week days.
Initial download of the metrics may take a while.