Fig. A.3
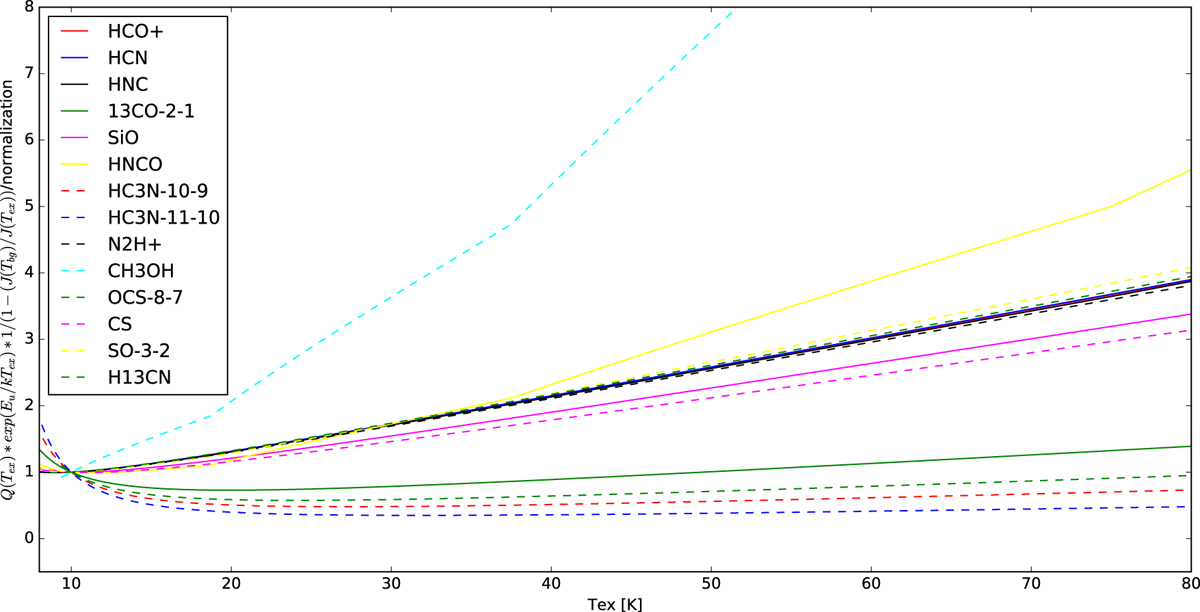
Variation of column density with excitation temperature, Tex. The y-axis shows the Tex-dependent parameters in Eq. (1) normalized to Tex = 10 K. For 13CO(2 − 1), we can see that the difference between the assumption of Tex = 10 K and 40 K (which is the temperature estimated by the detailed work of Torii et al. (2010a) is ~ 10%. Most of the species in the 3-mm molecular transitions show a factor of less than two if we increase the Tex at 40 K, with the exception of CH3 OH which is highly dependent of the Tex; and OCS and HC3N.
Current usage metrics show cumulative count of Article Views (full-text article views including HTML views, PDF and ePub downloads, according to the available data) and Abstracts Views on Vision4Press platform.
Data correspond to usage on the plateform after 2015. The current usage metrics is available 48-96 hours after online publication and is updated daily on week days.
Initial download of the metrics may take a while.