Fig. 1
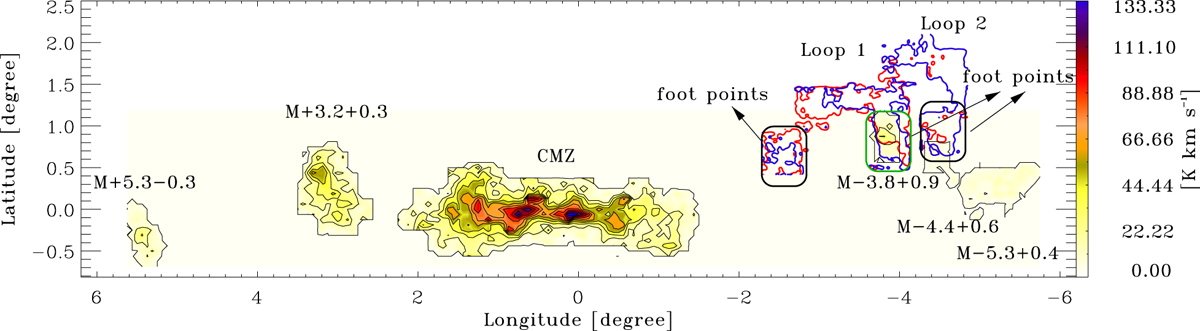
Overview of the large scale GC region showing the features discussed in this work. The CMZ and five molecular clouds are indicated by the HCO+(1 − 0) emission from Riquelme et al. (2010b). Loops 1 and 2 are plotted in the CO(2 − 1) emissionfrom Kudo et al. (2011). Loop 1 is integrated in the velocity range − 180 to − 90 km s−1 (blue contour), and loop 2 from − 90 to − 40 km s−1 (red contour). The footpoints are indicated with the black ellipse. The green ellipse shows the M−3.8+0.9 molecular cloud studied in this work.
Current usage metrics show cumulative count of Article Views (full-text article views including HTML views, PDF and ePub downloads, according to the available data) and Abstracts Views on Vision4Press platform.
Data correspond to usage on the plateform after 2015. The current usage metrics is available 48-96 hours after online publication and is updated daily on week days.
Initial download of the metrics may take a while.