Fig. 2
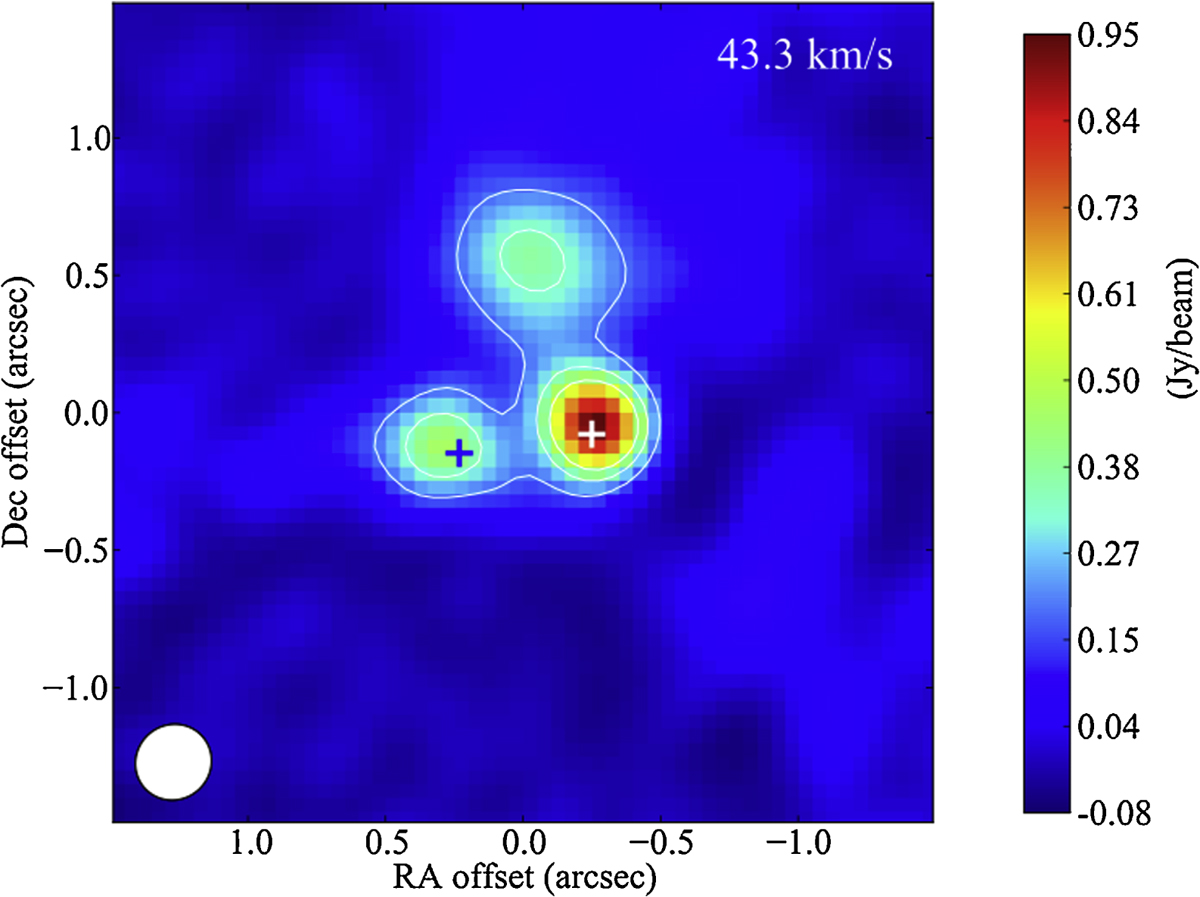
ALMA observations of CO(3–2) towards the Mira AB system at vlsr = 43.3 km s−1. The white and blue plus symbols show the positions of omi Cet (Mira A) and VZ Cet (Mira B), respectively. The contours are overlaid on the image with 20, 35, and 50% of the peak value. The observed CI emission likely arises from the region near Mira B. The beam is shown in the lower left corner.
Current usage metrics show cumulative count of Article Views (full-text article views including HTML views, PDF and ePub downloads, according to the available data) and Abstracts Views on Vision4Press platform.
Data correspond to usage on the plateform after 2015. The current usage metrics is available 48-96 hours after online publication and is updated daily on week days.
Initial download of the metrics may take a while.