Fig. 1
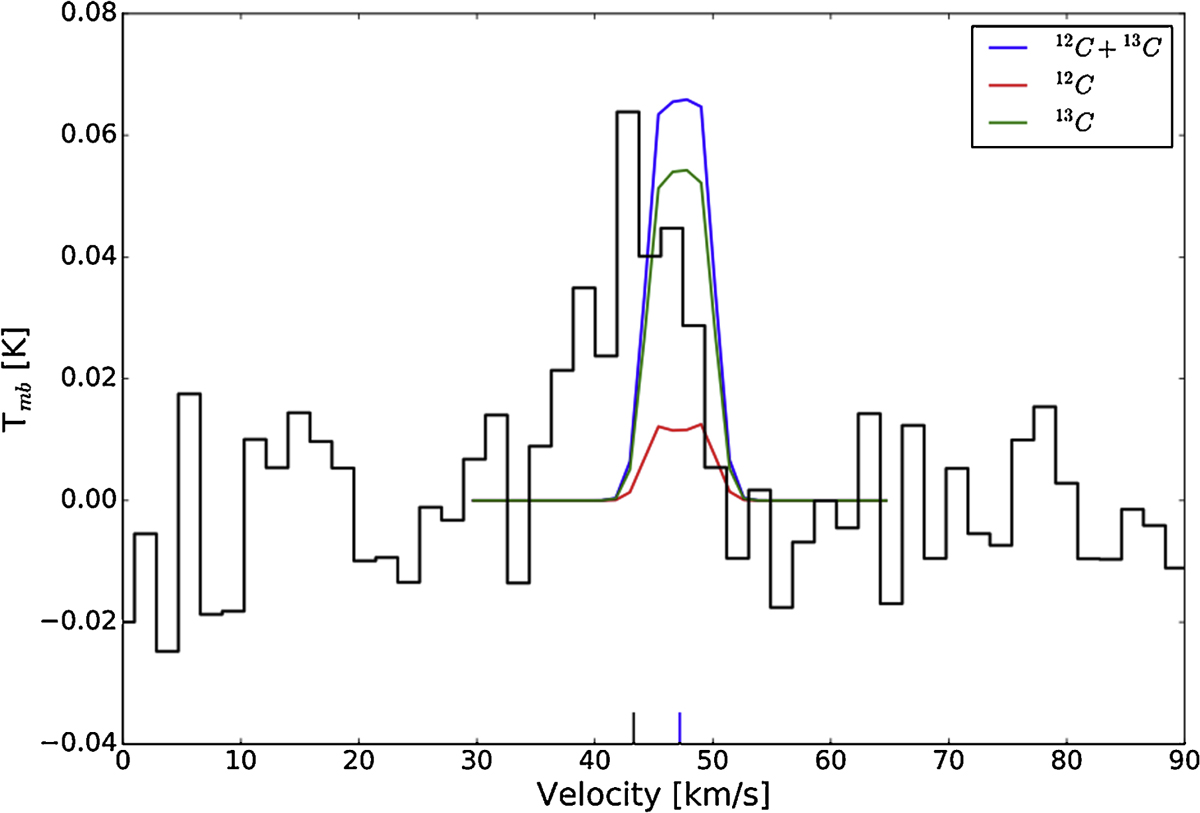
CI emission towards omi Cet at 1.8 km s−1 velocity resolution (black). The stellar vLSR (47.2 km s−1) and the spectrum peaks vLSR (43.4 km s−1) are indicated as vertical markers on the x-axis in blue and black, respectively. The results of RT modelling of both 12 C and 13 C isotopes are also shown in red and green, respectively. The blue profile indicates the total amount of C.
Current usage metrics show cumulative count of Article Views (full-text article views including HTML views, PDF and ePub downloads, according to the available data) and Abstracts Views on Vision4Press platform.
Data correspond to usage on the plateform after 2015. The current usage metrics is available 48-96 hours after online publication and is updated daily on week days.
Initial download of the metrics may take a while.