Fig. 1
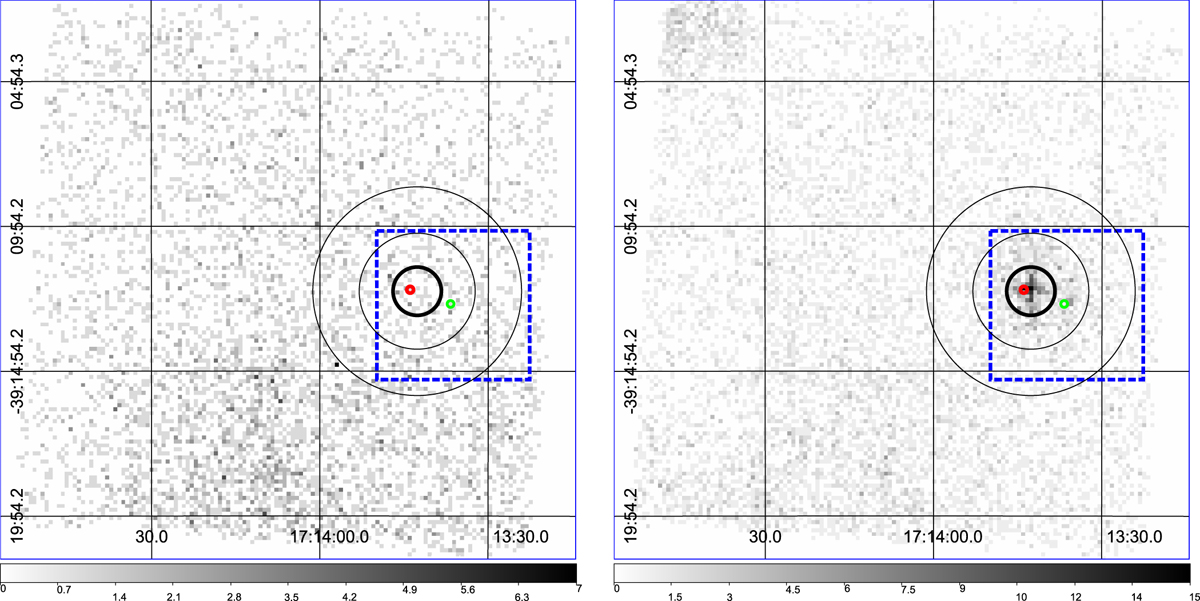
Suzaku XIS3 0.5–2 keV (left) and 2–10 keV (right) image of the AX J1714.1−3912 region in J2000 coordinates. The grayscale is in the linear scale in the unit of counts pixel−1. Thick and thin circles indicate source and background regions for timing and spectral analysis. The blue dashed box indicates the field of view of Fig. 4. Red and green circles indicate the position of CXOU J171343.9−391205 and CXOU J171336.7−391235, respectively.
Current usage metrics show cumulative count of Article Views (full-text article views including HTML views, PDF and ePub downloads, according to the available data) and Abstracts Views on Vision4Press platform.
Data correspond to usage on the plateform after 2015. The current usage metrics is available 48-96 hours after online publication and is updated daily on week days.
Initial download of the metrics may take a while.