Fig. 9
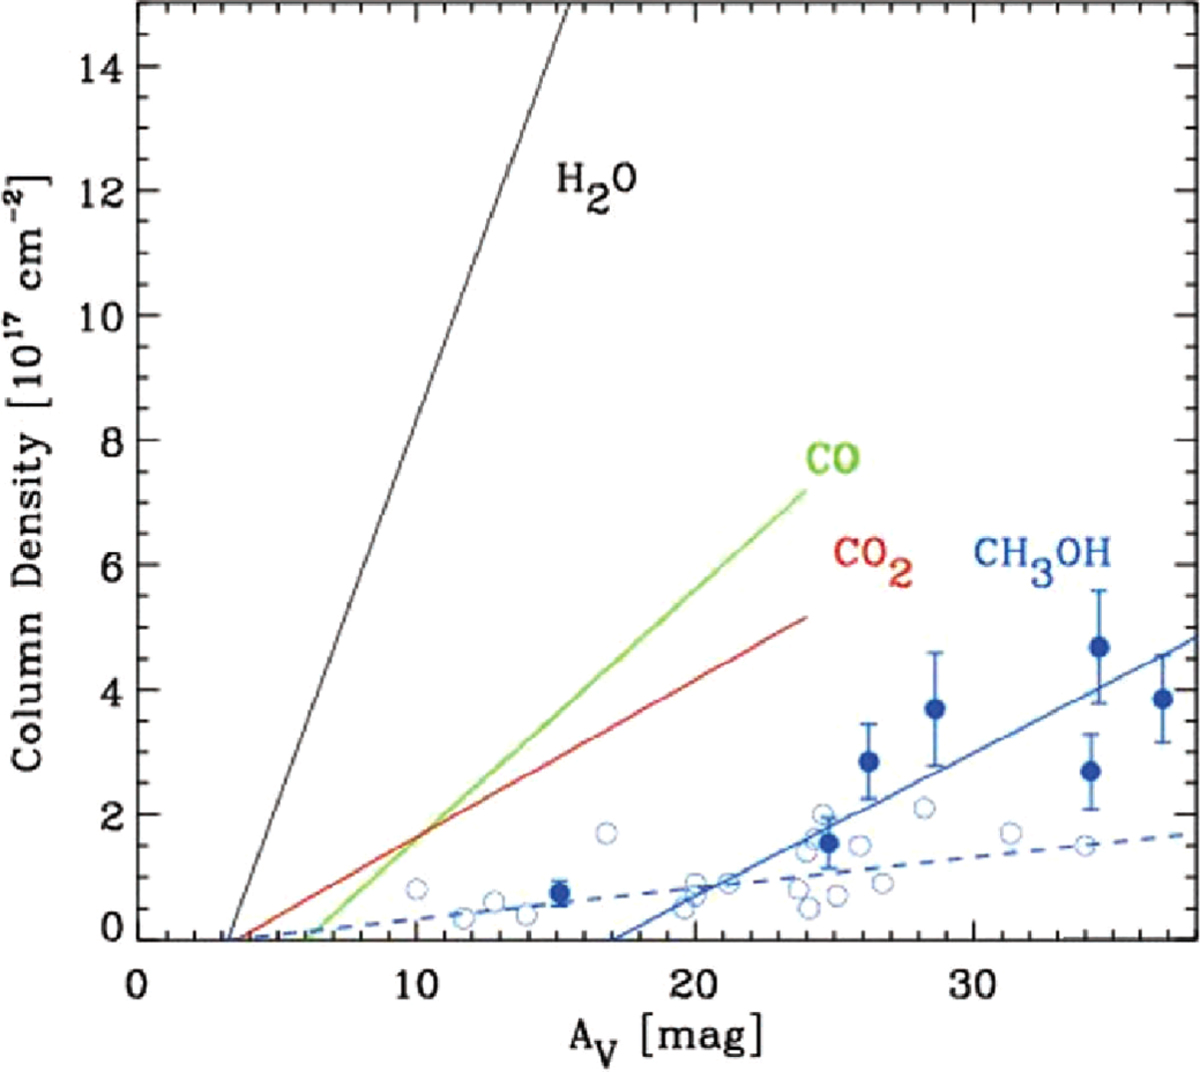
Relationships between ice column density and visual extinction (AV) as observed toward stars behind dense clouds and cores for H2O (black), CO (green), CO2 (red), and CH3OH (blue). For clarity, for H2O, CO, and CO2, the least-squares linear fits are shown and not the actual data points. For CH3 OH, blue bullets indicate detections with 1-σ error bars and open circles indicate 3-σ upper limits. The solid blue line is a fit to the detections, and the dashed blue line (from exp. 1.0) indicates the scenario in which CH3OH has the same ice formation threshold as H2O at a maximum abundance of CH3OH:H2O = 4%, as found in the listed experiments. The 3 σ upper limits prove in principle that CH3OH:H2O is less than 4% in the observed sight lines. This figure was adapted from Fig. 7 in Boogert et al. (2015).
Current usage metrics show cumulative count of Article Views (full-text article views including HTML views, PDF and ePub downloads, according to the available data) and Abstracts Views on Vision4Press platform.
Data correspond to usage on the plateform after 2015. The current usage metrics is available 48-96 hours after online publication and is updated daily on week days.
Initial download of the metrics may take a while.