Fig. 12
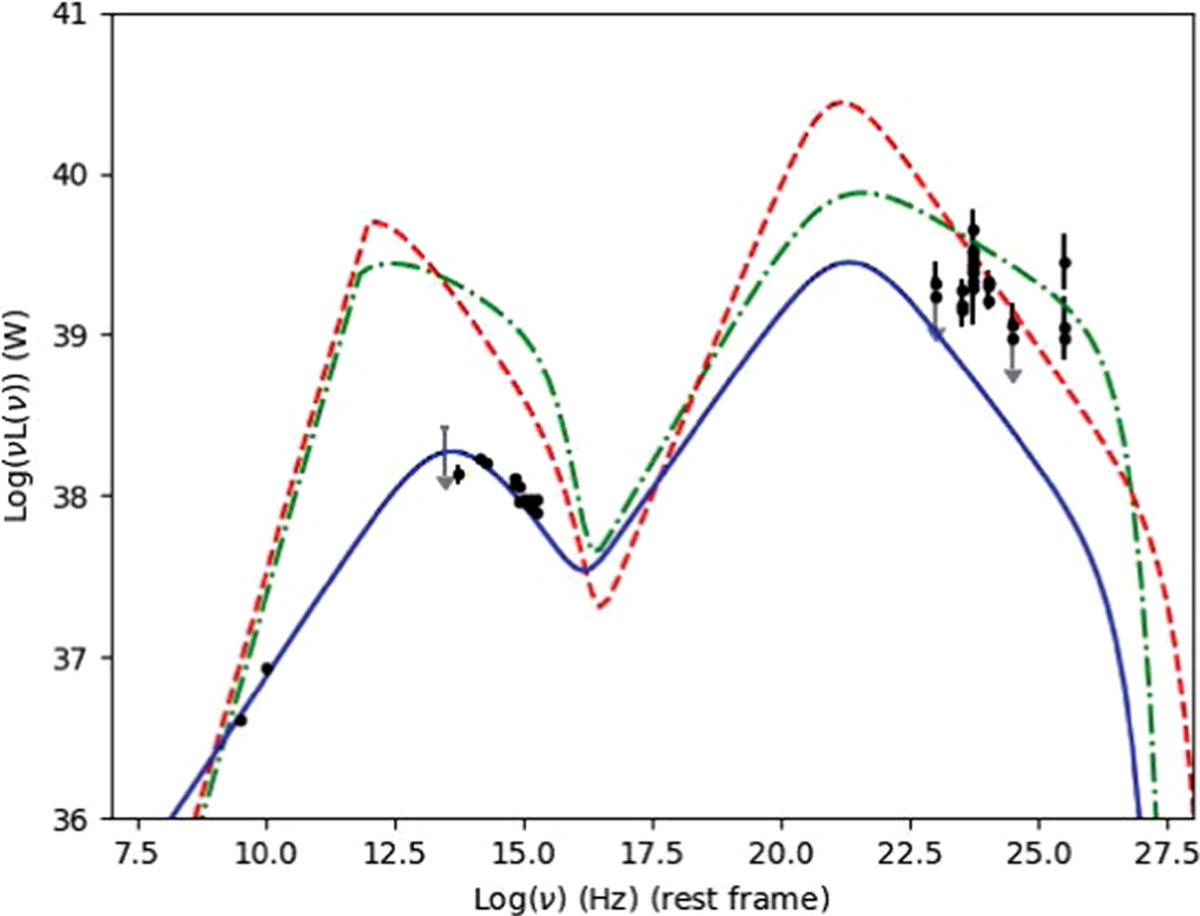
SED of the source in Complex A (calculated in the rest frame of the source at z = 1.142). Black dots represent radio (VLA A-configuration), infrared (WISE), optical (SDSS), and γ-ray (Fermi) observations. Gray arrows indicate upper limits. Dashed red, and dotted-dashed green lines are the SED derived by Ghisellini et al. (2017) for the Fermi-detected FSRQ and BL Lac objects, respectively, in the luminosity bin of 1040 − 1041 W. Solid blue line is obtained via fitting the synchrotron peak and keeping the inverse Compton peak at the frequency derived by Ghisellini et al. (2017; for further details see text).
Current usage metrics show cumulative count of Article Views (full-text article views including HTML views, PDF and ePub downloads, according to the available data) and Abstracts Views on Vision4Press platform.
Data correspond to usage on the plateform after 2015. The current usage metrics is available 48-96 hours after online publication and is updated daily on week days.
Initial download of the metrics may take a while.