Fig. 3
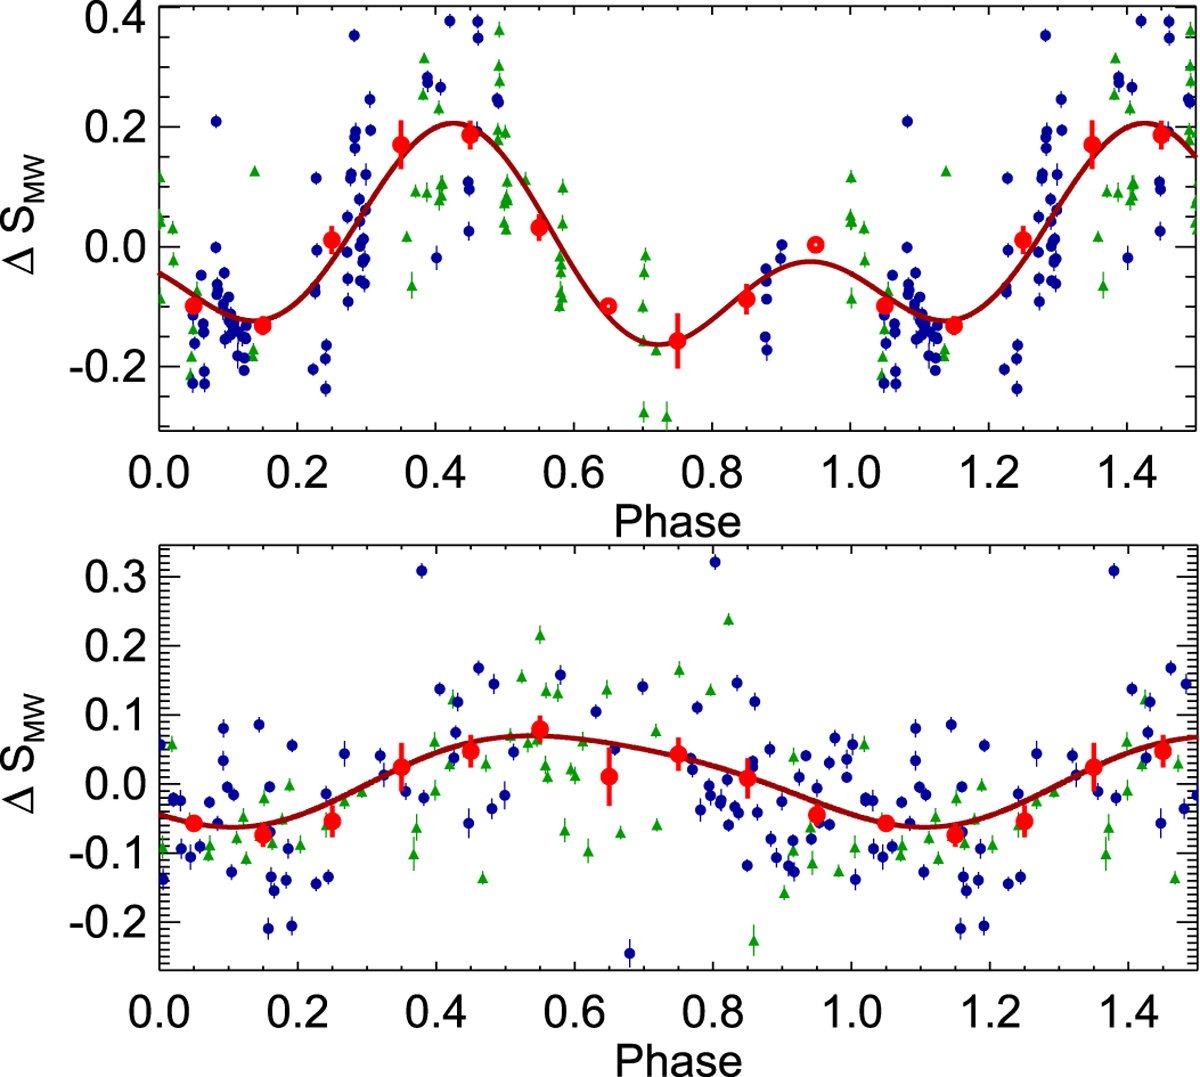
Phase-folded fit of the SMW index time series of the star GJ 740 using the 5.6 yr signal (top panel) and the 38.3 d signal (bottom panel) using double-harmonic sinusoidal fits at P and P/2. Red dots show the mean measurement in each phase bin. In each case the contribution of the other signal has been subtracted. Blue dots show the HARPS-N data, green triangles show the HARPS data.
Current usage metrics show cumulative count of Article Views (full-text article views including HTML views, PDF and ePub downloads, according to the available data) and Abstracts Views on Vision4Press platform.
Data correspond to usage on the plateform after 2015. The current usage metrics is available 48-96 hours after online publication and is updated daily on week days.
Initial download of the metrics may take a while.