Free Access
Fig. 2
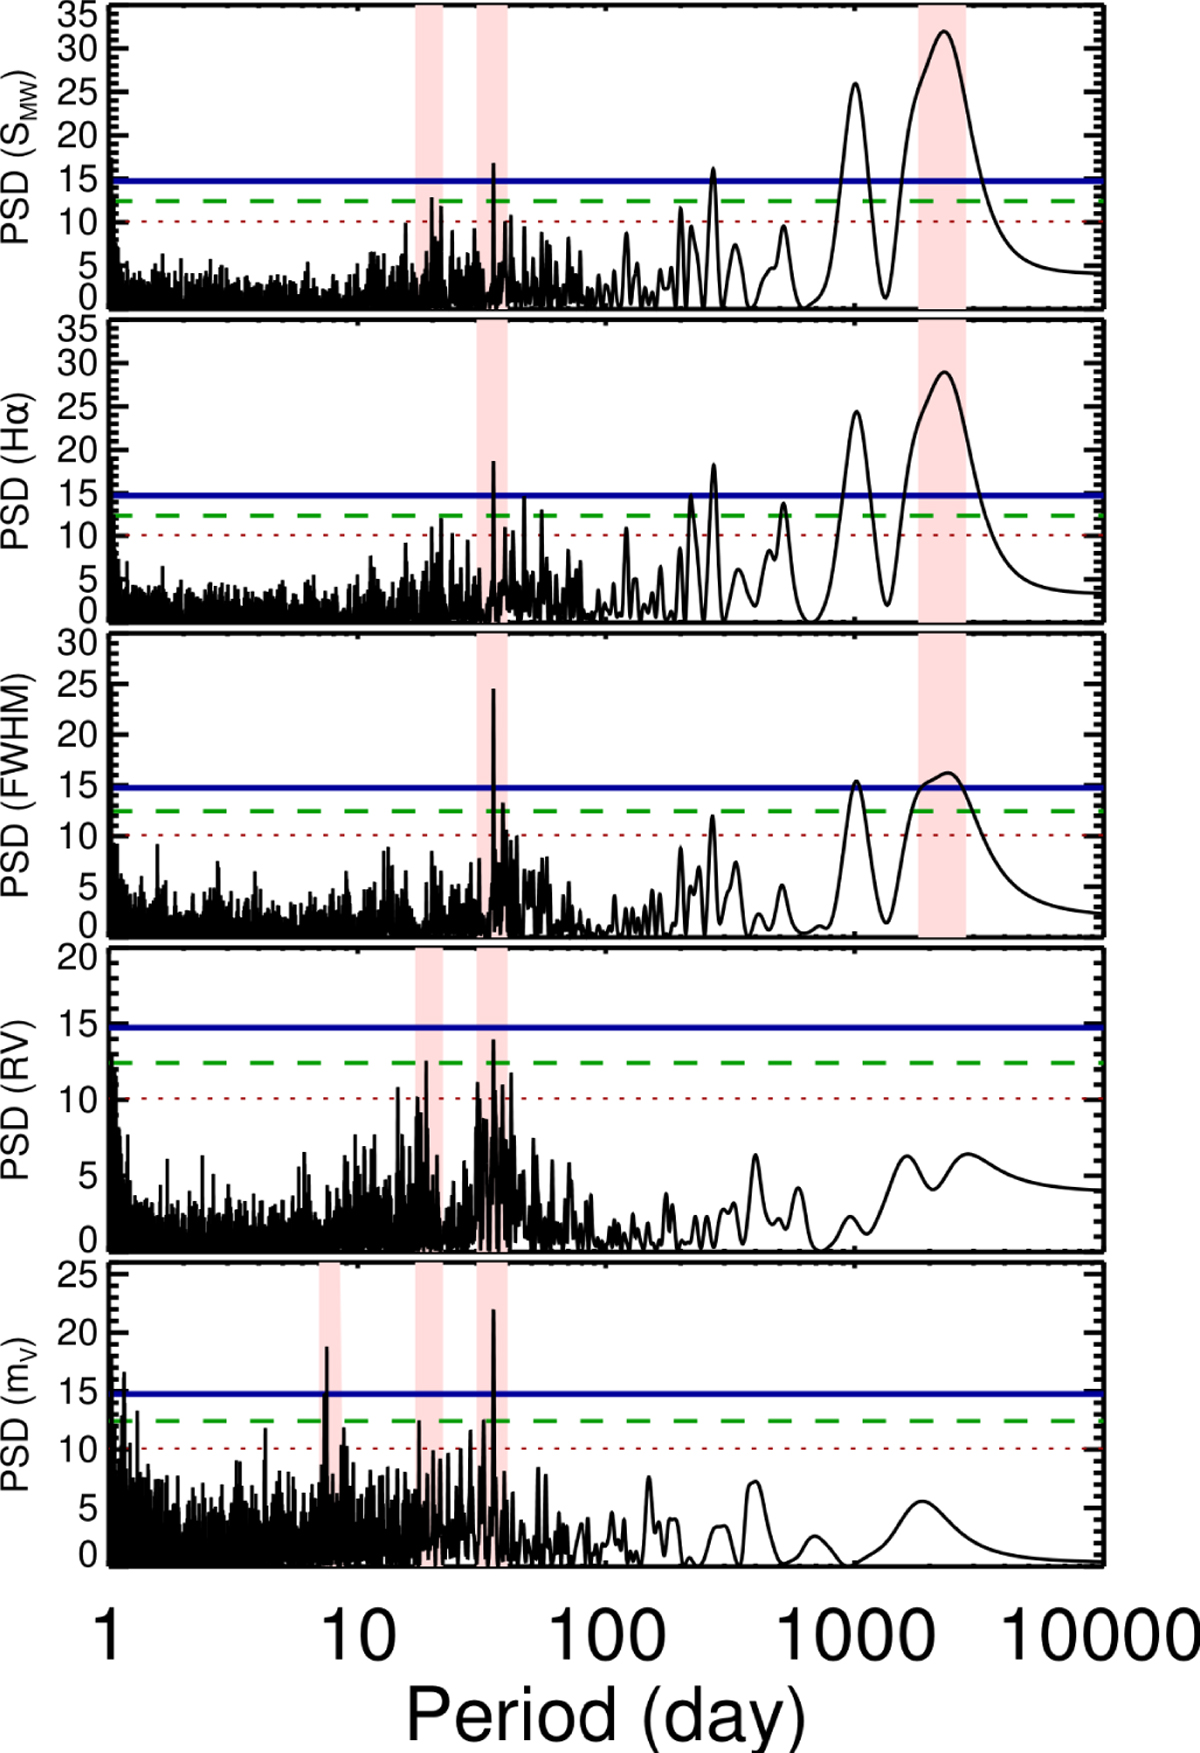
GLS periodograms of the SMW index, Hα index, FWHM, RV time series, and ASAS MV light-curve of the star GJ 740. The shaded regions show the discussed signals. The horizontal lines show the 10% (red dotted line), 1% (green dashed line) and 0.1% (blue solid line) FAP.
Current usage metrics show cumulative count of Article Views (full-text article views including HTML views, PDF and ePub downloads, according to the available data) and Abstracts Views on Vision4Press platform.
Data correspond to usage on the plateform after 2015. The current usage metrics is available 48-96 hours after online publication and is updated daily on week days.
Initial download of the metrics may take a while.