Fig. 11
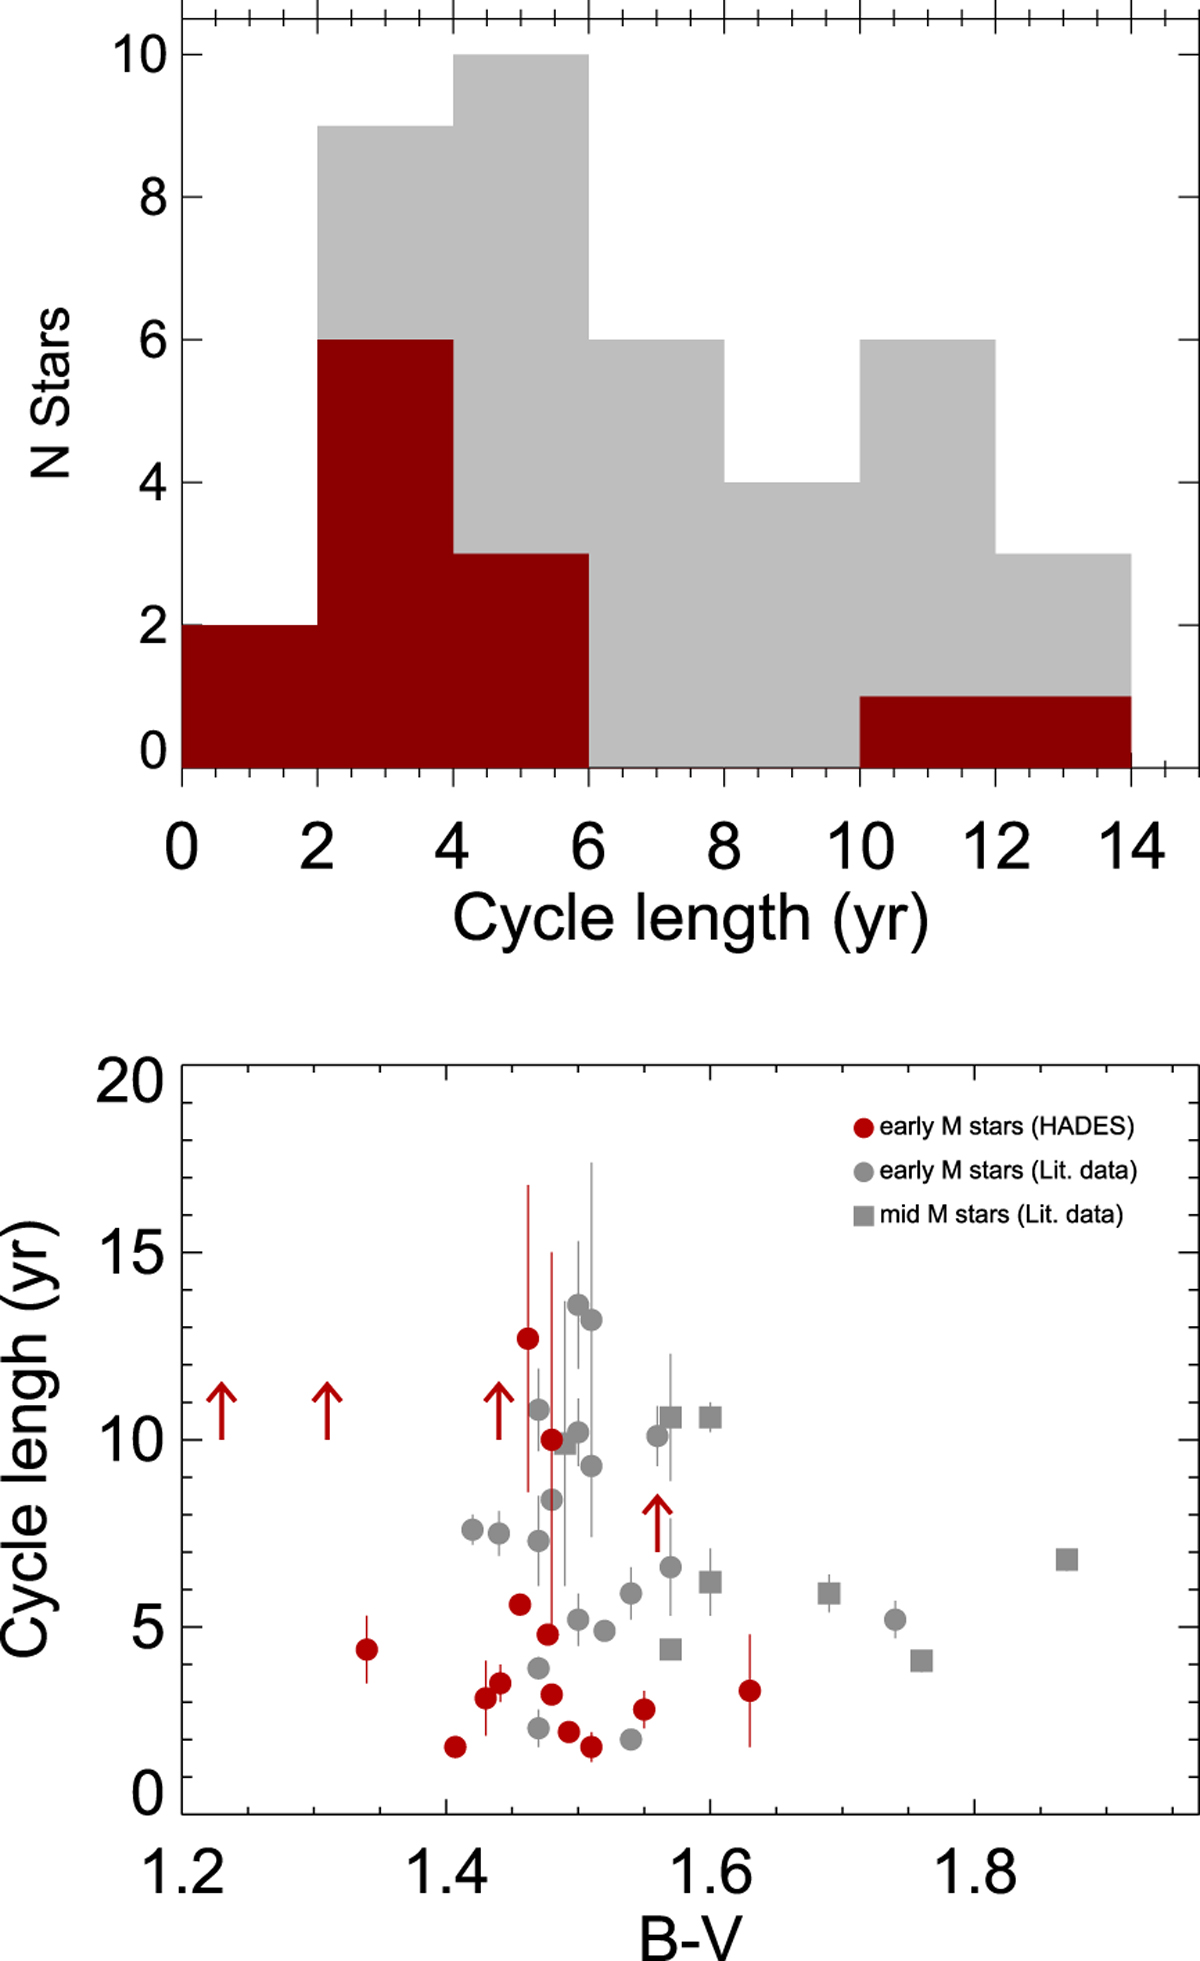
Top panel: distribution of the cycle lengths for the stars in our sample. The grey area shows the full sample, while the red highlight the fraction of new measurements. Bottom panel: cycle lengths against the color B–V of the stars. Vertical arrows indicate the lower limit of the periods for those cases where the presence of a cycle is detected but the period could not be determined.
Current usage metrics show cumulative count of Article Views (full-text article views including HTML views, PDF and ePub downloads, according to the available data) and Abstracts Views on Vision4Press platform.
Data correspond to usage on the plateform after 2015. The current usage metrics is available 48-96 hours after online publication and is updated daily on week days.
Initial download of the metrics may take a while.