Fig. 7
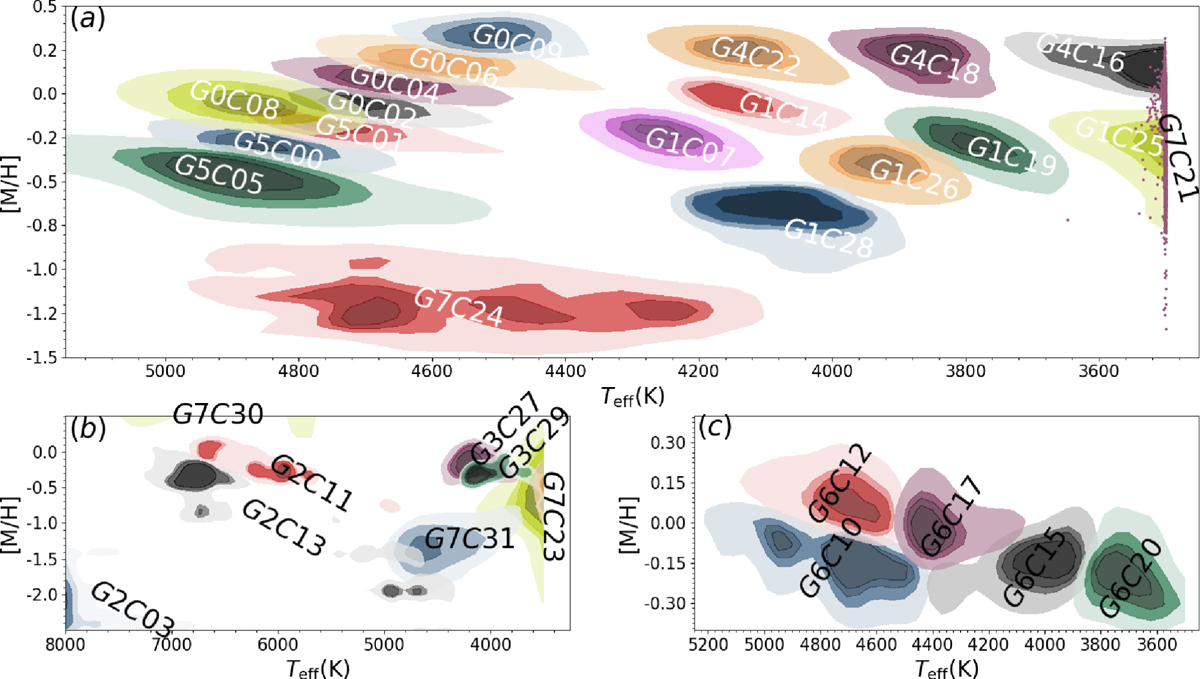
Contour diagrams in the Teff −[M∕H] plane. Different colours are used to distinguish different classes. Each class is represented by four colour shades; from dark to light, the shades enclose 15, 30, 45, and 68.3 per cent of the data points in the class. The groups are separated into three panels minimising the superposition of classes. Panel a: groups 0, 1, 4, 5, and two classes of group 7; panel b: groups 2,3, and three classes of group 7; and panel c: group 6. In these panels each class is flagged with a floating label in the form GXCXX, C referring to class and G to its group. Class 21 is represented as a scatter plot, since it is too concentrated to present visible contours on this scale.
Current usage metrics show cumulative count of Article Views (full-text article views including HTML views, PDF and ePub downloads, according to the available data) and Abstracts Views on Vision4Press platform.
Data correspond to usage on the plateform after 2015. The current usage metrics is available 48-96 hours after online publication and is updated daily on week days.
Initial download of the metrics may take a while.