Fig. C.1
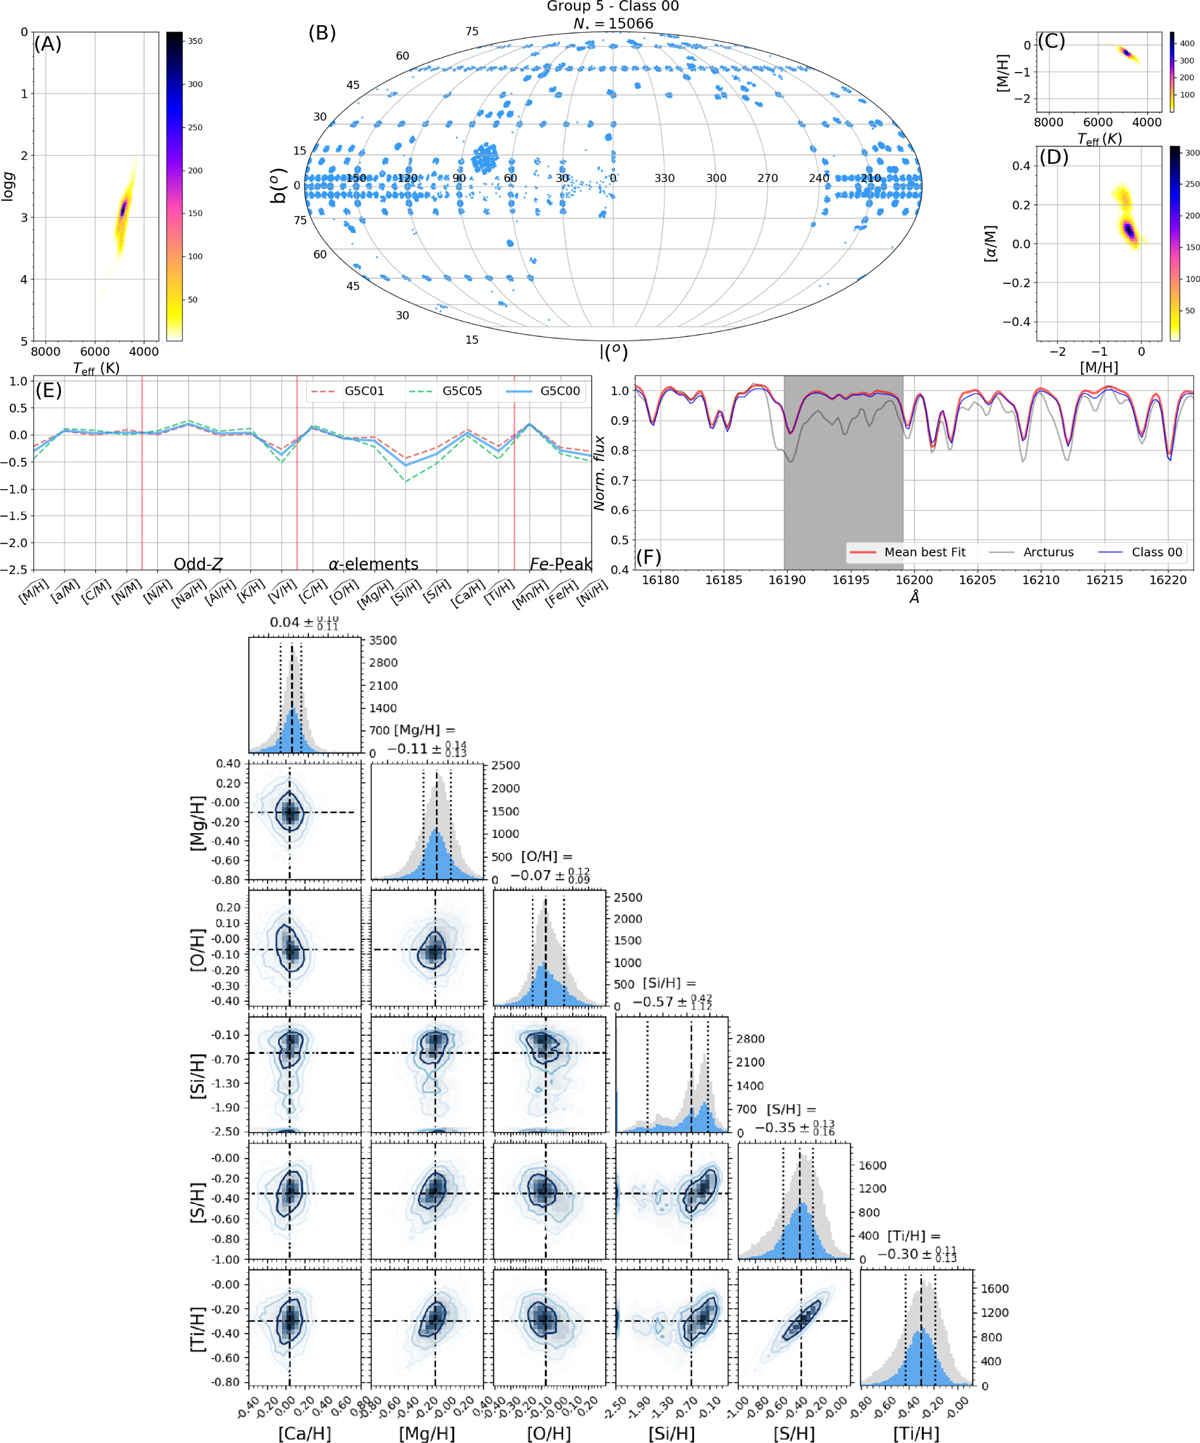
Panel A: 2D histogram in the Teff – log g plane; panel B: galactic coordinates distribution; panel C: 2D histogram of the class in the Teff – [M/H] plane; panel D: 2D histogram in the [M/H] – [α/M] plane; panel E: parallel plot for all the atmospheric parameters and individual chemical elements available in DR12 for all classes in each group, depicting the main class as a solid line and the other classes as dashed lines. The colours used here are the same as those used in Fig. 7; and panel F: comparison of the mean spectra of the class (blue line) with the mean best fit model for each spectra in the class (red line) and also shows the Arcturus spectrum (grey line) for comparison. The second figure in the file is a corner plot for Teff, log g, [M/H], [C/H], [N/H] and [α/M]. The figure contains 15 panels comparing these quantities with each other in 2D histograms. Four contours mark the levels enclosing 15, 30, 45, and 68.3 per cent of the points in each class. The top panel in each column gives the histogram comparing the class parameter distribution (using the same colours used in Fig. 7) with the distribution in its corresponding group (gray bars); the median values and the region enclosing 68.3 per cent of the points around the mean are marked by vertical lines and the values are shown above the top panels.
Current usage metrics show cumulative count of Article Views (full-text article views including HTML views, PDF and ePub downloads, according to the available data) and Abstracts Views on Vision4Press platform.
Data correspond to usage on the plateform after 2015. The current usage metrics is available 48-96 hours after online publication and is updated daily on week days.
Initial download of the metrics may take a while.