Fig. 17
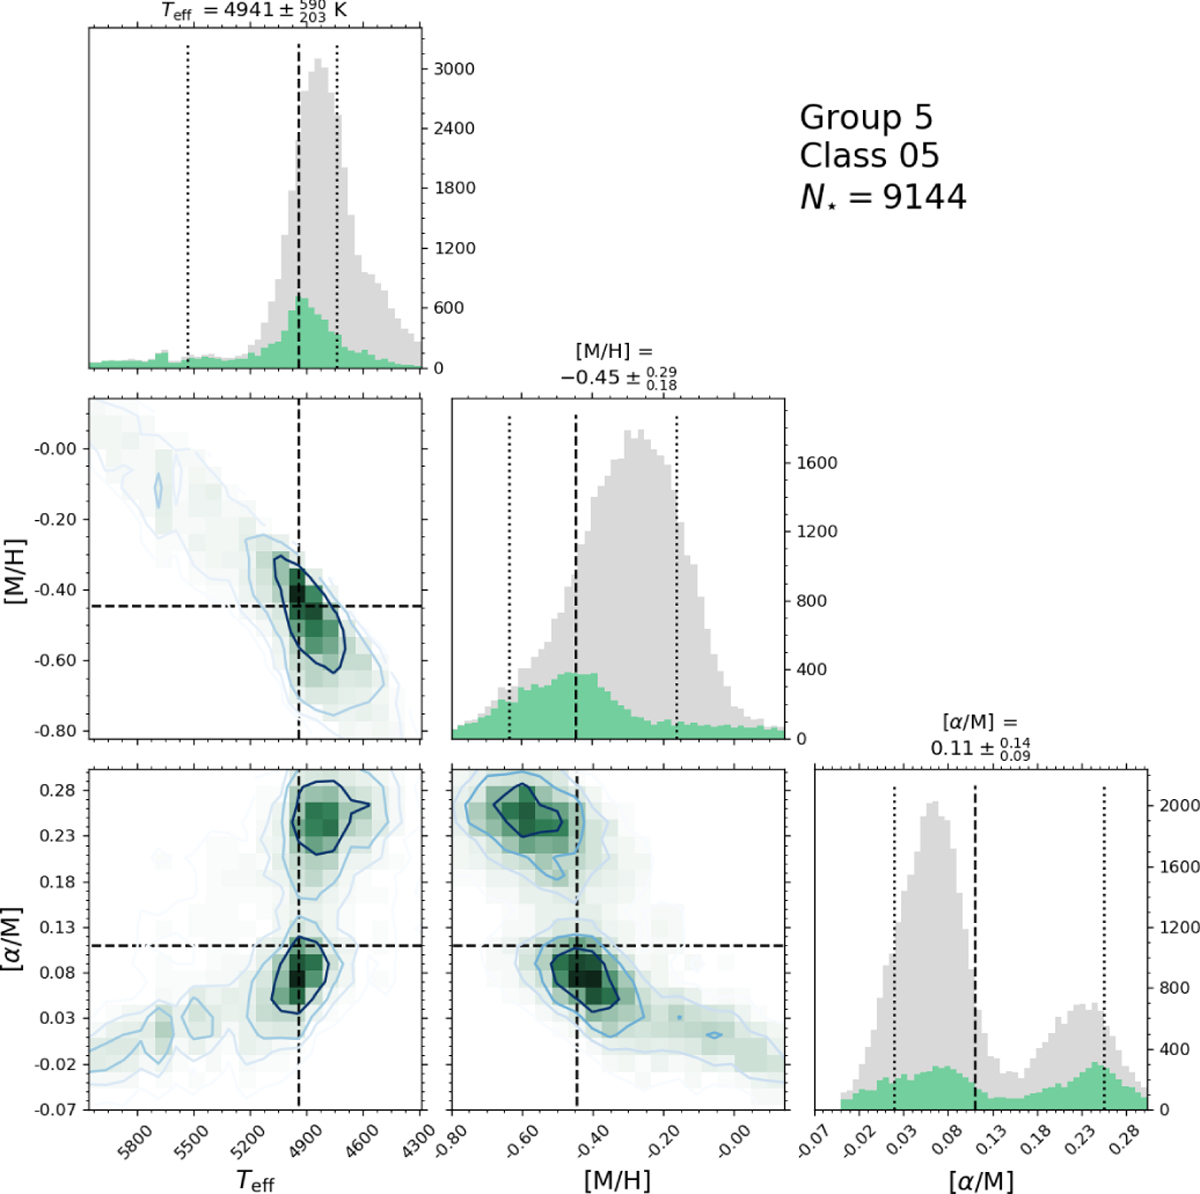
Properties of class 5 (group 5), which contains 9144 stars (N⋆). The panels in the uppermost diagonal contain histograms for Teff, [M/H] and [α/M], from left to right, respectively. In these plots vertical black dashed lines show the median value and the limits enclosing 68.3 percent of the data points around the median value. The green histograms correspond to the objects in class 5 and the grey histogram shows the distribution of the whole group 5. As indicated by labels in the axes, the other three panels show 2D histograms for Teff − [M∕H], Teff − [α∕M] and [α∕M] −[M∕H]. From outside to inside the contours enclose 68.3, 45, 30, and 15 per cent of the objects in the class.
Current usage metrics show cumulative count of Article Views (full-text article views including HTML views, PDF and ePub downloads, according to the available data) and Abstracts Views on Vision4Press platform.
Data correspond to usage on the plateform after 2015. The current usage metrics is available 48-96 hours after online publication and is updated daily on week days.
Initial download of the metrics may take a while.