Fig. 1
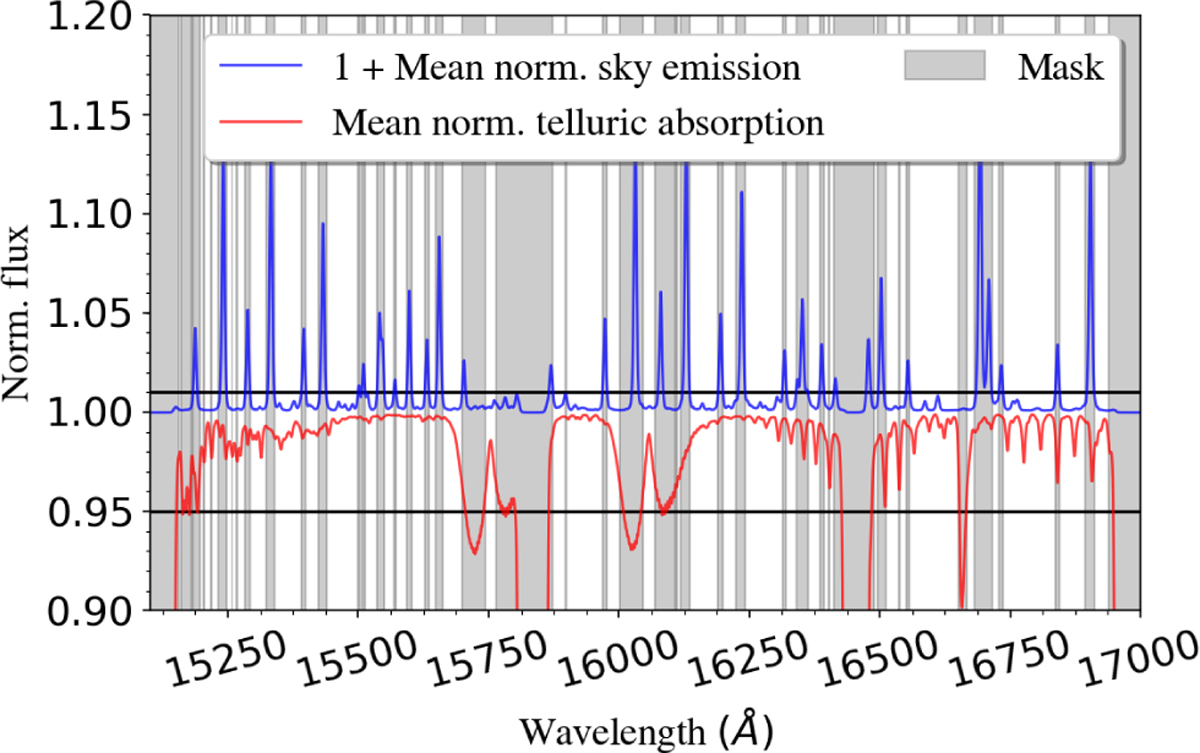
Mean sky normalised emissions (blue line) and telluric absorption (red line) spectra for the 153 847 spectra in the sample. Mean sky normalised emissions fluxes are displaced by one unit to help visualisation. Black lines define the cut applied to each spectrum. Grey shades highlight the areas excluded from theK-means classification.
Current usage metrics show cumulative count of Article Views (full-text article views including HTML views, PDF and ePub downloads, according to the available data) and Abstracts Views on Vision4Press platform.
Data correspond to usage on the plateform after 2015. The current usage metrics is available 48-96 hours after online publication and is updated daily on week days.
Initial download of the metrics may take a while.