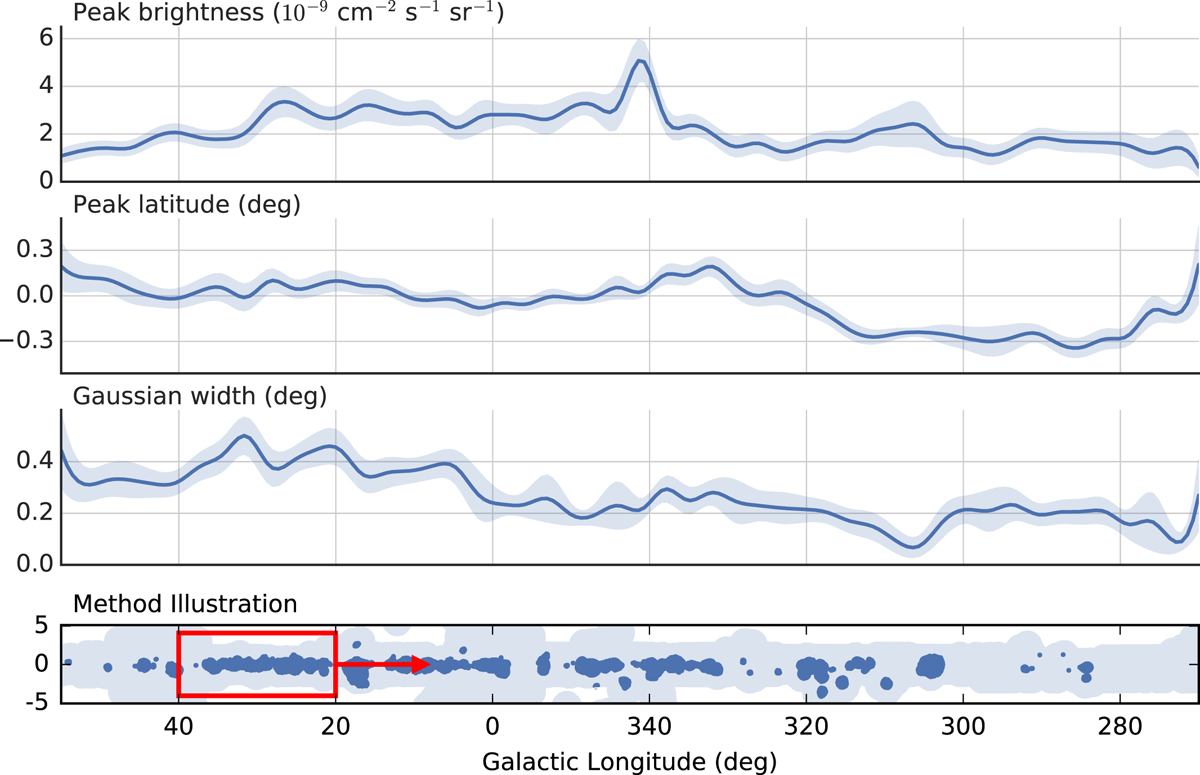
Fig. 6

Distribution of the fit large-scale emission model parameters with Galactic longitude. The first panel gives the peak brightness of the large-scale emission model in units of 10−9 cm−2 s−1 sr−1 (≈ 1.3% Crab deg−2). The second panel shows the peak position of the Gaussian along the Galactic latitude axis in degrees and the third panel shows the width (σ) of the Gaussian in degrees. The solid lines are the result of fitting each set of parameters every 2.5° in longitude and interpolating. The light blue bands show the 1σ error region obtained from the covariance matrix of the likelihood function. The lower panel illustrates the 20° wide sliding-window method (red rectangle) that was used to determine the large-scale emission model in areas (shown in light blue) where the HGPS sensitivity is better than 2.5% Crab but outside exclusion regions (shown in dark blue); this is explained in further detail in the main text.
Current usage metrics show cumulative count of Article Views (full-text article views including HTML views, PDF and ePub downloads, according to the available data) and Abstracts Views on Vision4Press platform.
Data correspond to usage on the plateform after 2015. The current usage metrics is available 48-96 hours after online publication and is updated daily on week days.
Initial download of the metrics may take a while.


