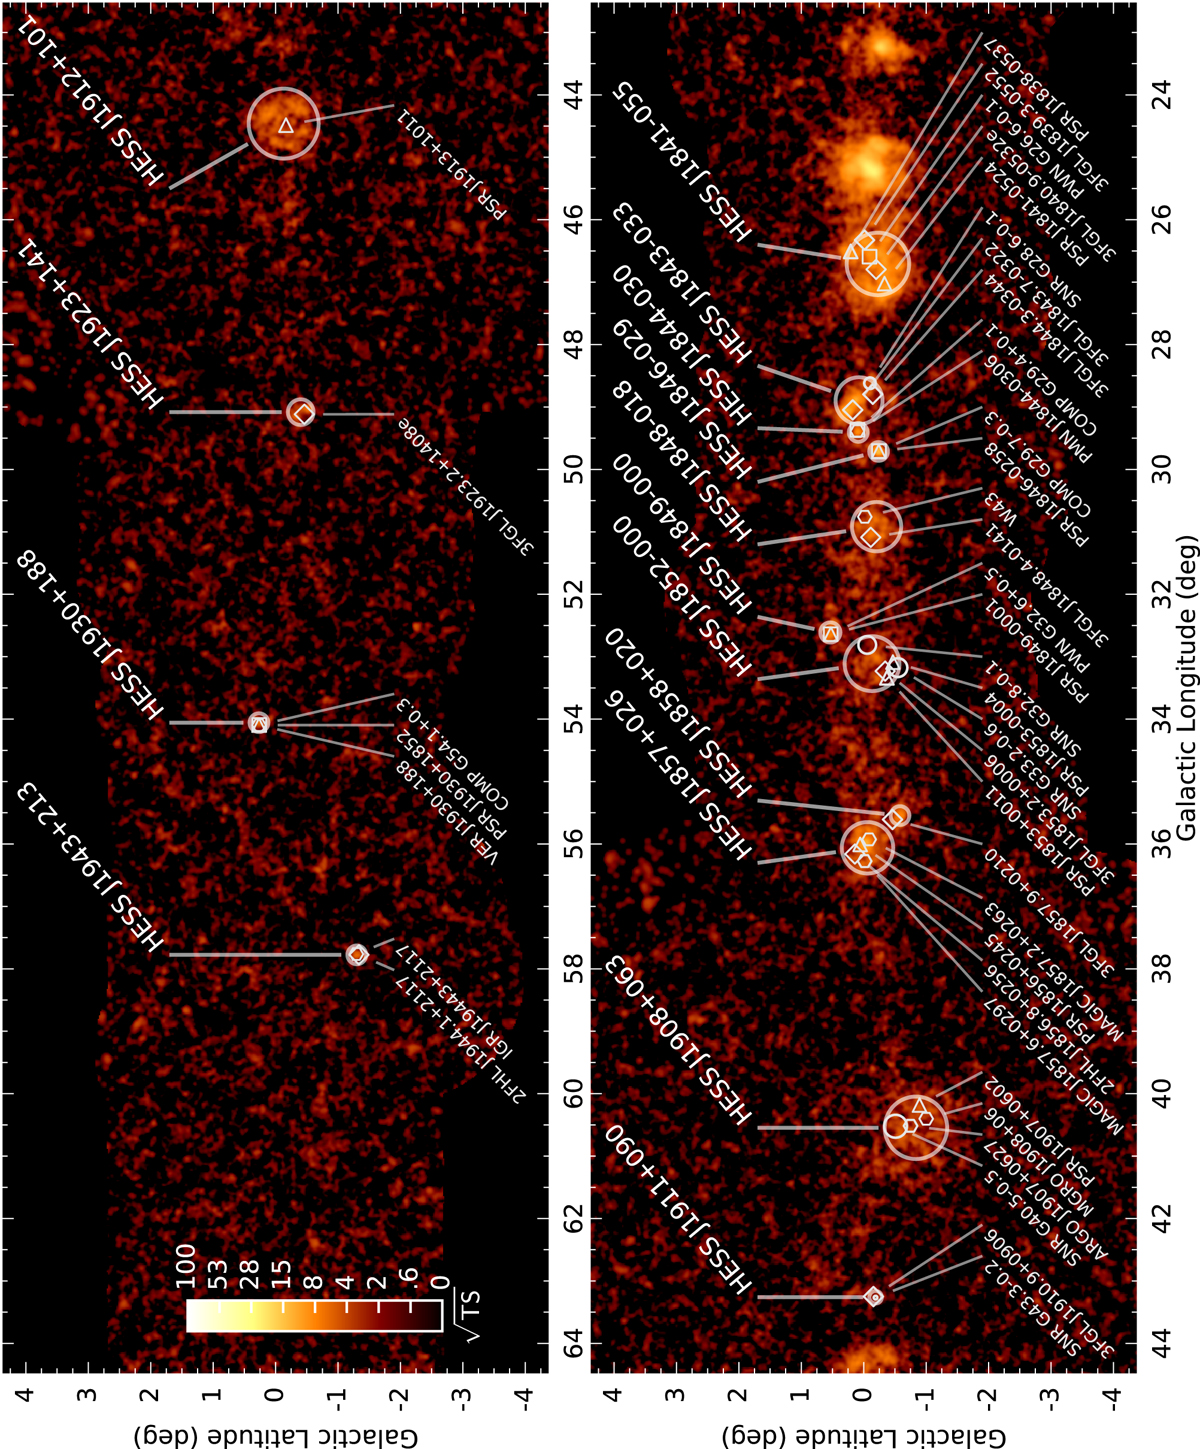
Fig. A.2

HGPS sources and associations in context (1 of 4). The background image shows
![]() of the VHE γ-ray excess in the Galactic plane assuming a point source morphology. All HGPS catalog sources are shown on top with transparent circles that correspond to the measured size of the source. Source names are labeled above the Galactic plane. Associations for the sources are shown with markers in white and corresponding labels. Pulsar (PSR) associations from the ATNF catalog are shown with triangles; SNRs as white circles with the radius representing the size, PWN and Composite (COMP) associations from the SNRcat catalog are marked with squares; associations with Fermi-LAT 3FGL and 2FHL sources are shown with diamonds; extra associations are shown with hexagonal markers. 3FGL sources are not labeled when they are identical to the pulsar. 2FHL sources are not labeled, when they are identical to the 3FGL source. The various object categories and the association criteria applied are detailed in Sect. 5.1.
of the VHE γ-ray excess in the Galactic plane assuming a point source morphology. All HGPS catalog sources are shown on top with transparent circles that correspond to the measured size of the source. Source names are labeled above the Galactic plane. Associations for the sources are shown with markers in white and corresponding labels. Pulsar (PSR) associations from the ATNF catalog are shown with triangles; SNRs as white circles with the radius representing the size, PWN and Composite (COMP) associations from the SNRcat catalog are marked with squares; associations with Fermi-LAT 3FGL and 2FHL sources are shown with diamonds; extra associations are shown with hexagonal markers. 3FGL sources are not labeled when they are identical to the pulsar. 2FHL sources are not labeled, when they are identical to the 3FGL source. The various object categories and the association criteria applied are detailed in Sect. 5.1.
Current usage metrics show cumulative count of Article Views (full-text article views including HTML views, PDF and ePub downloads, according to the available data) and Abstracts Views on Vision4Press platform.
Data correspond to usage on the plateform after 2015. The current usage metrics is available 48-96 hours after online publication and is updated daily on week days.
Initial download of the metrics may take a while.


