Fig. 1
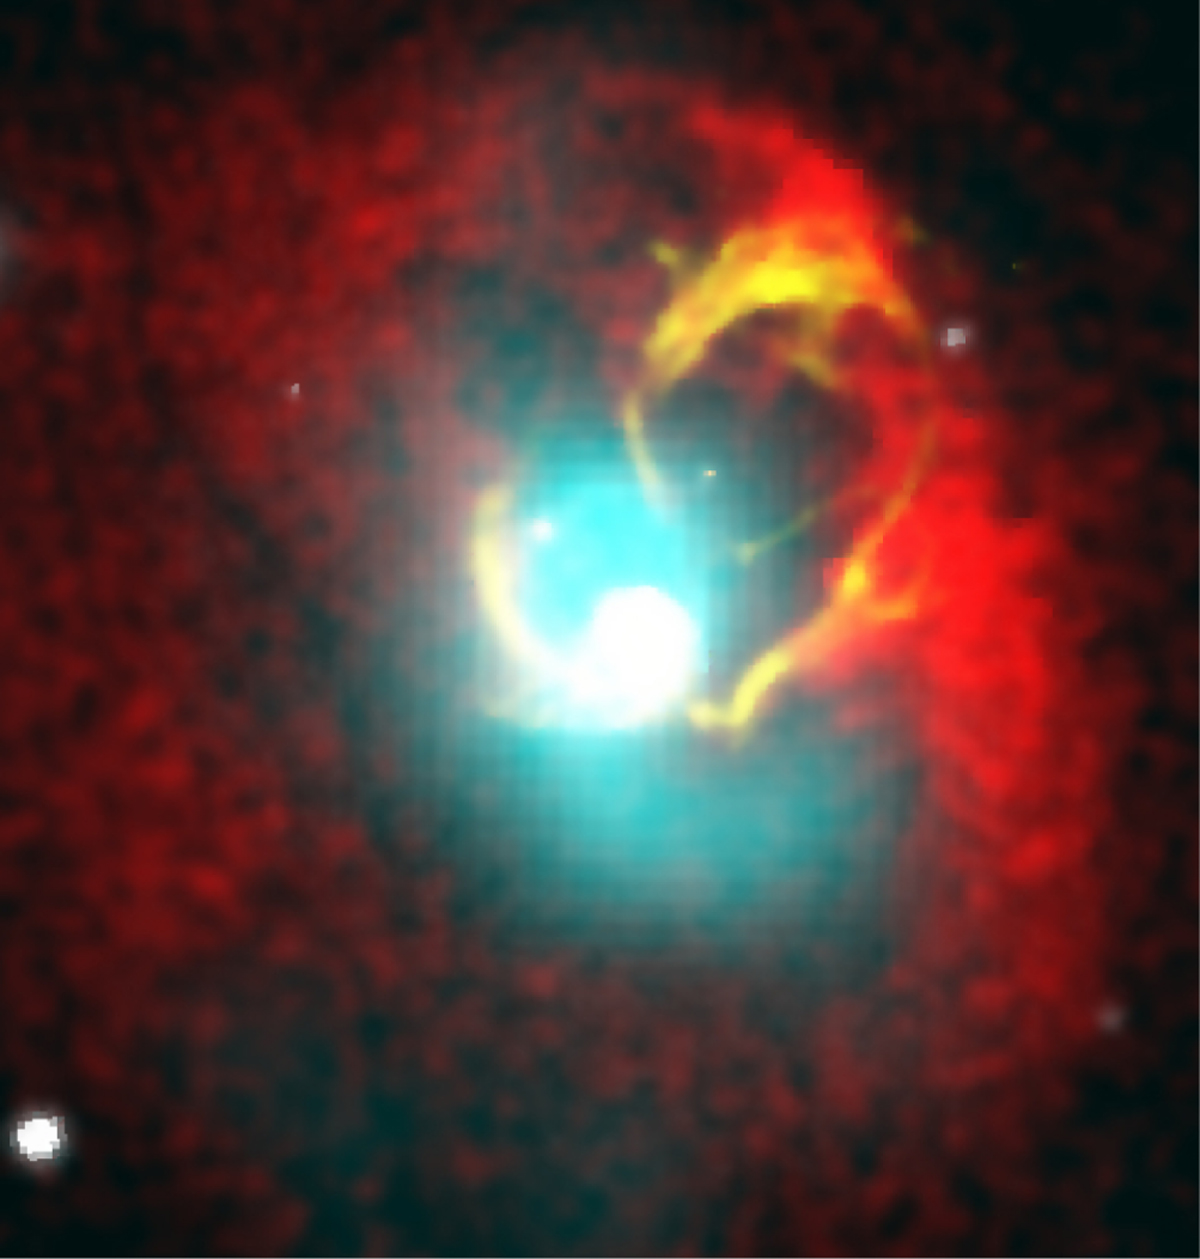
Multiwavelength composite image of the central regions of the A2052 cluster. Optical continuum image in the r band from the Sloan Digital Sky Survey (white), radio map from the Very Large Array (cyan), X-ray emission from Chandra (red) and the Hα+[N II] emitting filaments we observed with VLT/MUSE (yellow). The image covers the MUSE field of view, i.e., 60′′ × 60′′, 41.4 × 41.4 kpc.
Current usage metrics show cumulative count of Article Views (full-text article views including HTML views, PDF and ePub downloads, according to the available data) and Abstracts Views on Vision4Press platform.
Data correspond to usage on the plateform after 2015. The current usage metrics is available 48-96 hours after online publication and is updated daily on week days.
Initial download of the metrics may take a while.