Free Access
Fig. 7
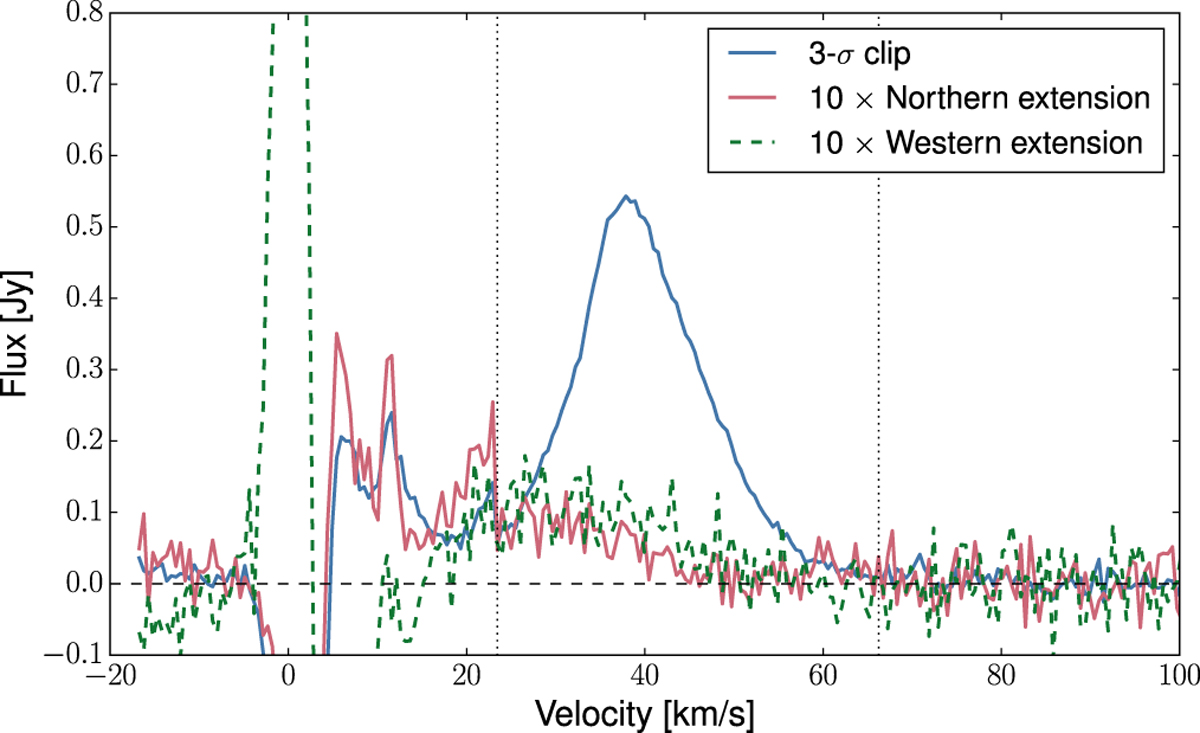
Spectra of the potential northern and western extensions, multiplied by a factor of ten to aid in comparison to spectrum of Leo T shown for comparison. The dashed black line indicates the baseline level, and the dotted vertical lines the velocity extent used for creating the total intensity H I map.
Current usage metrics show cumulative count of Article Views (full-text article views including HTML views, PDF and ePub downloads, according to the available data) and Abstracts Views on Vision4Press platform.
Data correspond to usage on the plateform after 2015. The current usage metrics is available 48-96 hours after online publication and is updated daily on week days.
Initial download of the metrics may take a while.