Fig. 5
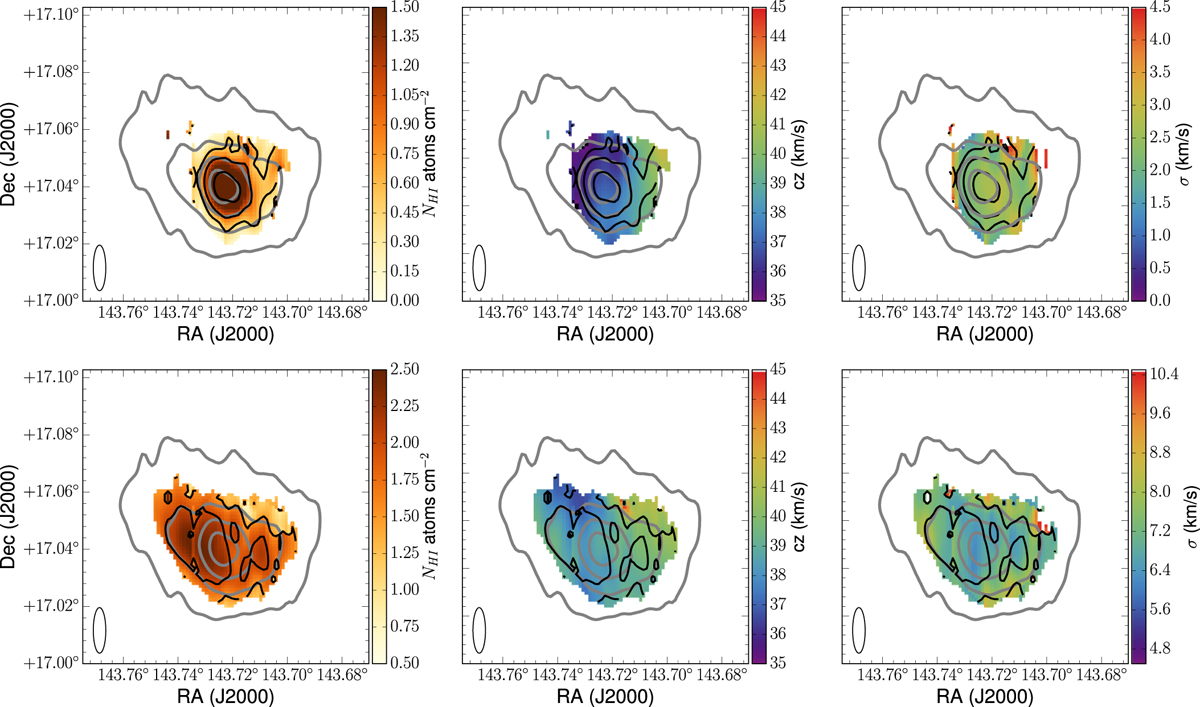
Results of the spatial decomposition of Leo T into a WNM and CNM component. The top row is the CNM component and the bottom the WNM component. Left to right the columns are: column density, central velocity, and velocity dispersion of the gas. The gray contours are the [1, 2, 3, 4] × 1020 atoms cm−2 level from the total column density map in Fig. 2. The black contours are the column density for each component; for the CNM the levels are [0.5, 1, 2] × 1020 atoms cm−2 and for the WNM the levels are [1.5, 2] × 1020 atoms cm−2.
Current usage metrics show cumulative count of Article Views (full-text article views including HTML views, PDF and ePub downloads, according to the available data) and Abstracts Views on Vision4Press platform.
Data correspond to usage on the plateform after 2015. The current usage metrics is available 48-96 hours after online publication and is updated daily on week days.
Initial download of the metrics may take a while.