Fig. 4
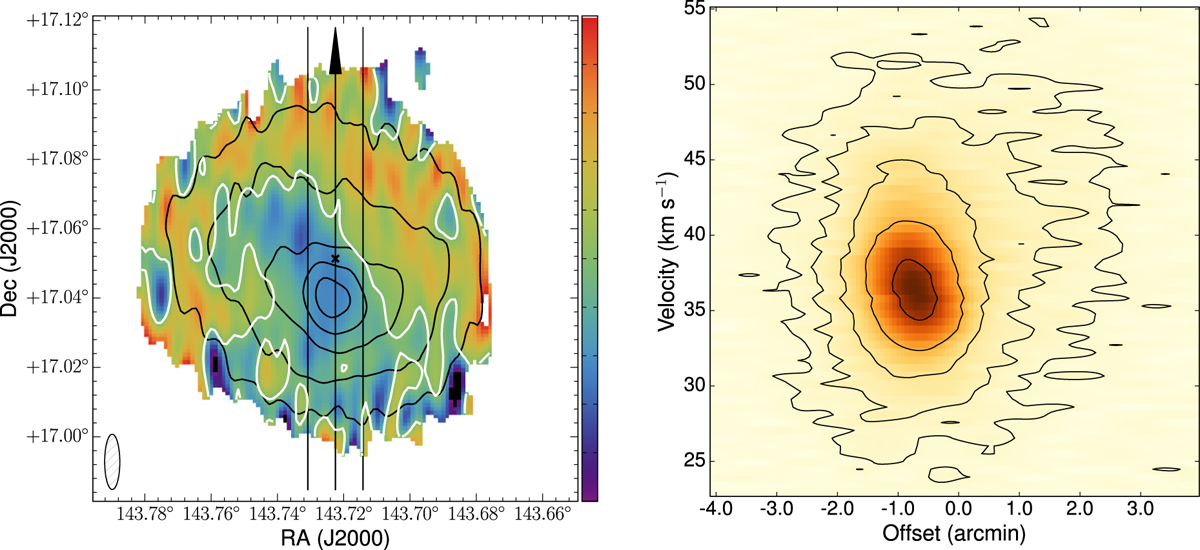
Left: Velocity field of Leo T as derived from the moment one map with the isovelocity contour at 40 km s−1 highlighted in white. The H I column density contours at [0.5, 1, 2, 3, 4] × 1020 atoms cm−2 are also shown in black. Right: Position-velocity slice of the H I in Leo T along a position angle of zero degrees with a width of 60′′ and centered on the optical centroid of the galaxy. The angle of this slice, extent, and center are shown overlaid on the velocity field in the left panel. The contours are at [2, 4, 8, 16, 32] times the rms of the data cube.
Current usage metrics show cumulative count of Article Views (full-text article views including HTML views, PDF and ePub downloads, according to the available data) and Abstracts Views on Vision4Press platform.
Data correspond to usage on the plateform after 2015. The current usage metrics is available 48-96 hours after online publication and is updated daily on week days.
Initial download of the metrics may take a while.