Free Access
Fig. 3
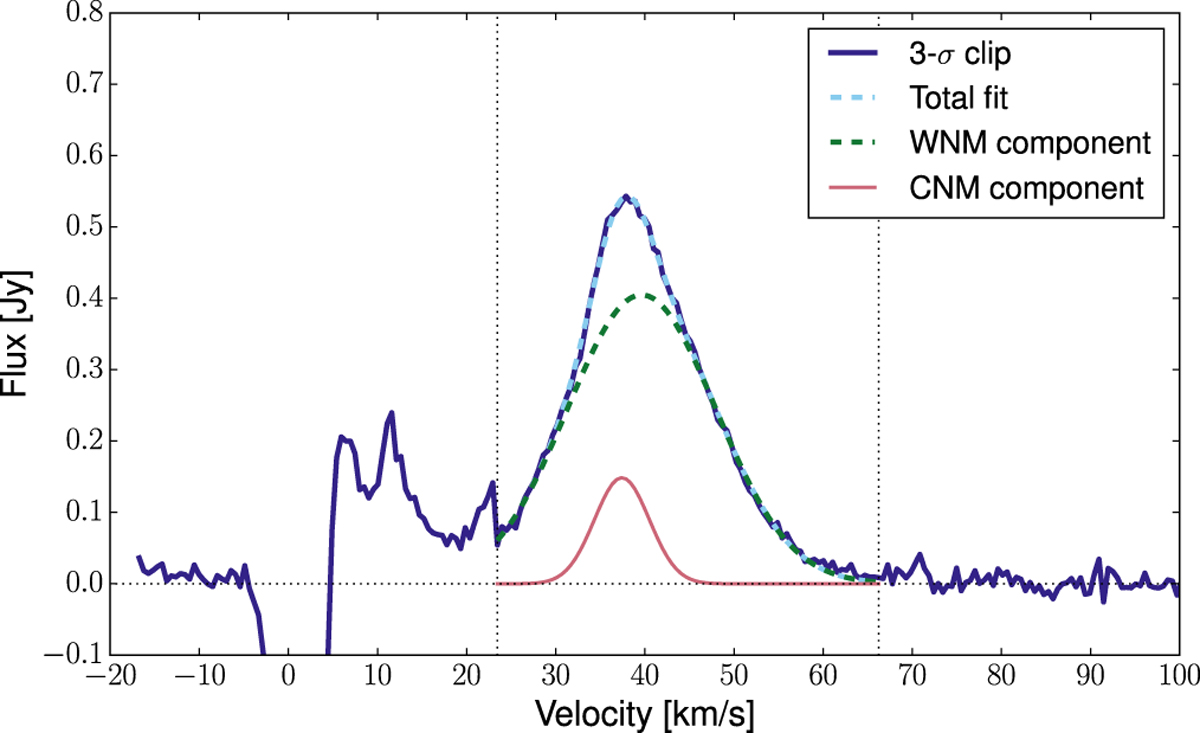
Spectrum of Leo T based on a 3-sigma clip of the total intensity H I map. The velocity range used for constructing the total intensity H I map is shown by the dotted vertical lines. In addition, a two Gaussian component fit to this spectrum in shown.
Current usage metrics show cumulative count of Article Views (full-text article views including HTML views, PDF and ePub downloads, according to the available data) and Abstracts Views on Vision4Press platform.
Data correspond to usage on the plateform after 2015. The current usage metrics is available 48-96 hours after online publication and is updated daily on week days.
Initial download of the metrics may take a while.