Fig. 1
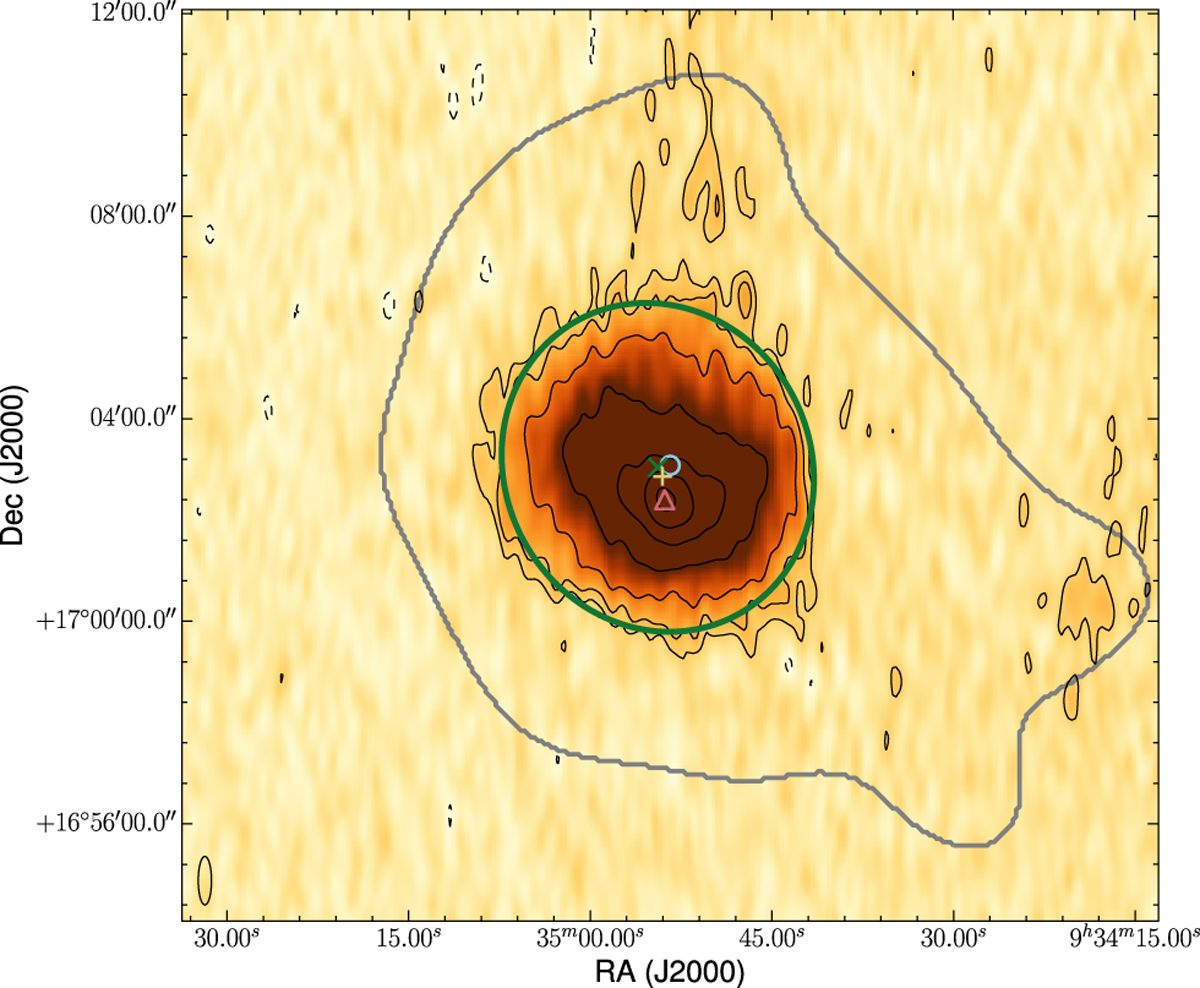
Non-primary-beam-corrected total intensity H I map of Leo T. Contours are at [−3, 3, 5, 10, 20, 40, 60, 80]-σ; the lowest contour level is approximately 1.6 × 10¹⁹ atoms cm−2. The mask used to define the Leo T source extent for cleaning is shown in gray. The light-blue circle is the optical center, the green x is the center of the H I ellipse, the yellow cross is the center of the H I distribution, the pink triangle is the peak of the H I distribution, and the large green circle is the H I extent at the 2.7 × 10¹⁹ atoms cm−2 level (Sect. 3.4).
Current usage metrics show cumulative count of Article Views (full-text article views including HTML views, PDF and ePub downloads, according to the available data) and Abstracts Views on Vision4Press platform.
Data correspond to usage on the plateform after 2015. The current usage metrics is available 48-96 hours after online publication and is updated daily on week days.
Initial download of the metrics may take a while.