Free Access
Fig. 10
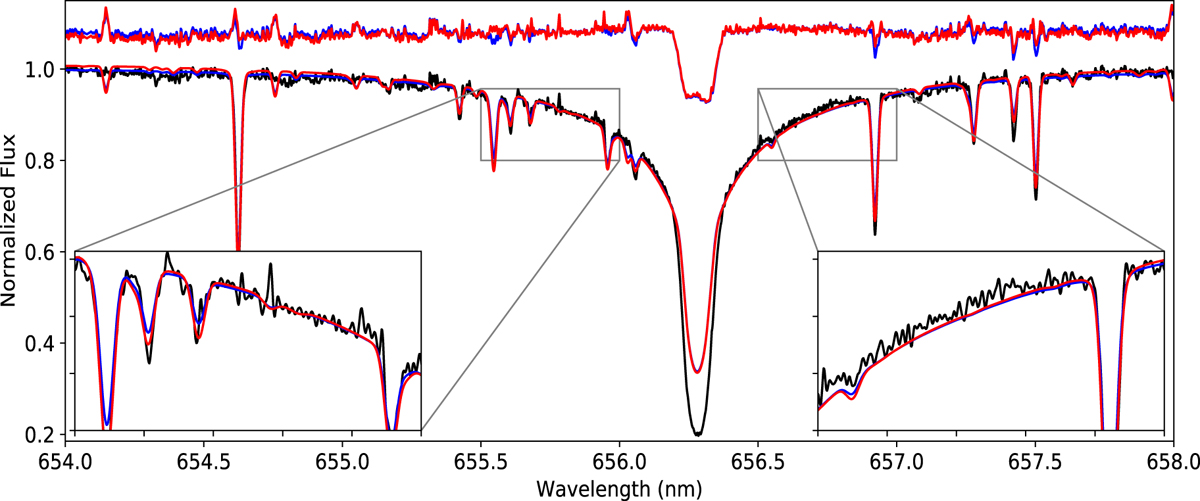
H-α region for WASP-20 (black) fitted with the best fitted model from D15 (red) and the best model from this work (blue). The near horizontal lines at flux 1.2 are the residuals between the D15 model (red) or wavelet model (blue) and the spectrum of WASP-20.
Current usage metrics show cumulative count of Article Views (full-text article views including HTML views, PDF and ePub downloads, according to the available data) and Abstracts Views on Vision4Press platform.
Data correspond to usage on the plateform after 2015. The current usage metrics is available 48-96 hours after online publication and is updated daily on week days.
Initial download of the metrics may take a while.