Fig. 2
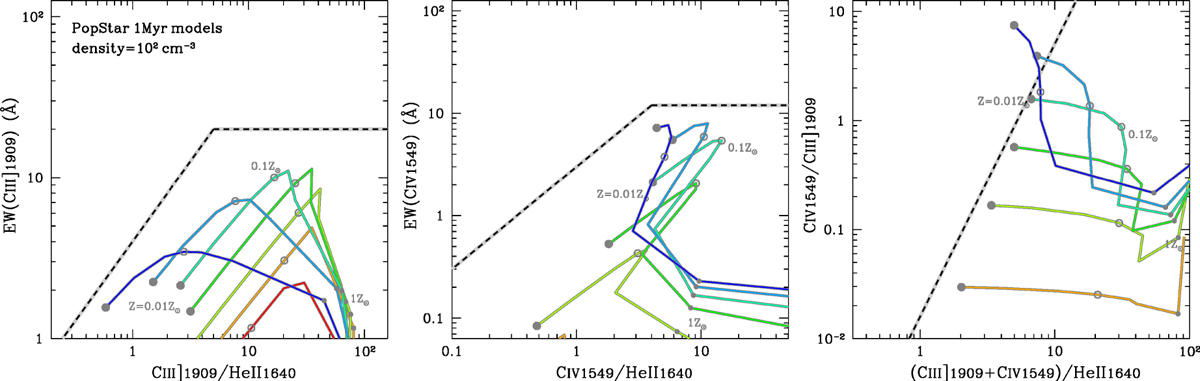
UV line diagrams for the SED of POPSTAR models (Fig. 1a). A gas density of 102 cm −3 is assumed. The curves present our grid of models in the range of Z = 0.01–2 Z⊙ for log U = −3.5 (red), − 3.0 (orange), − 2.5 (yellow), − 2.0 (green), − 1.5 (cyan), − 1.0 (skyblue), and − 0.5 (blue). The metallicity of Z = 0.01, 0.1, and 1 Z⊙ is denoted with a large filled, medium open, and small gray-filled circle, respectively, along each of the curves. The black dashed curves are the demarcations between a star-forming galaxy and AGN that will be defined in Sect. 4.1.
Current usage metrics show cumulative count of Article Views (full-text article views including HTML views, PDF and ePub downloads, according to the available data) and Abstracts Views on Vision4Press platform.
Data correspond to usage on the plateform after 2015. The current usage metrics is available 48-96 hours after online publication and is updated daily on week days.
Initial download of the metrics may take a while.