Fig. 18
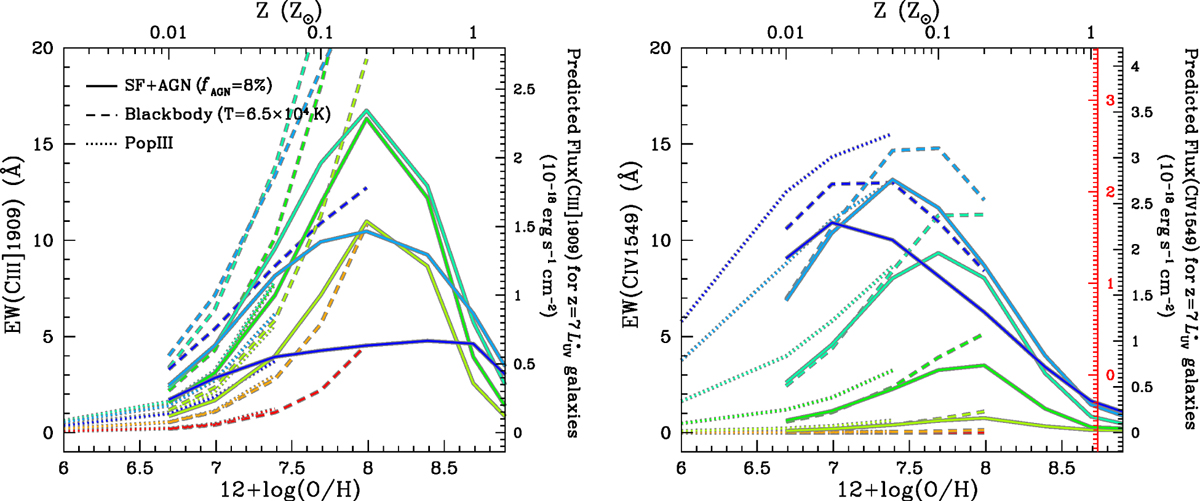
As inFig. 13, but with models of mixed SF+AGN (fAGN= 8%, solid), blackbody (T = 6.5 × 10⁴ K below Z = 0.2 Z⊙, dashed), andPopIII star (below Z = 0.05 Z⊙, dotted). In each plot, the right ordinate presents a flux predicted for ![]() galaxies at z = 7 with an EW corresponding to the left ordinate. For the CIV emission, the red right ordinate is added which shows a predicted flux if the stellar CIV absorption exists with EWabs (CIV) = −3 Å.
galaxies at z = 7 with an EW corresponding to the left ordinate. For the CIV emission, the red right ordinate is added which shows a predicted flux if the stellar CIV absorption exists with EWabs (CIV) = −3 Å.
Current usage metrics show cumulative count of Article Views (full-text article views including HTML views, PDF and ePub downloads, according to the available data) and Abstracts Views on Vision4Press platform.
Data correspond to usage on the plateform after 2015. The current usage metrics is available 48-96 hours after online publication and is updated daily on week days.
Initial download of the metrics may take a while.