Fig. 17
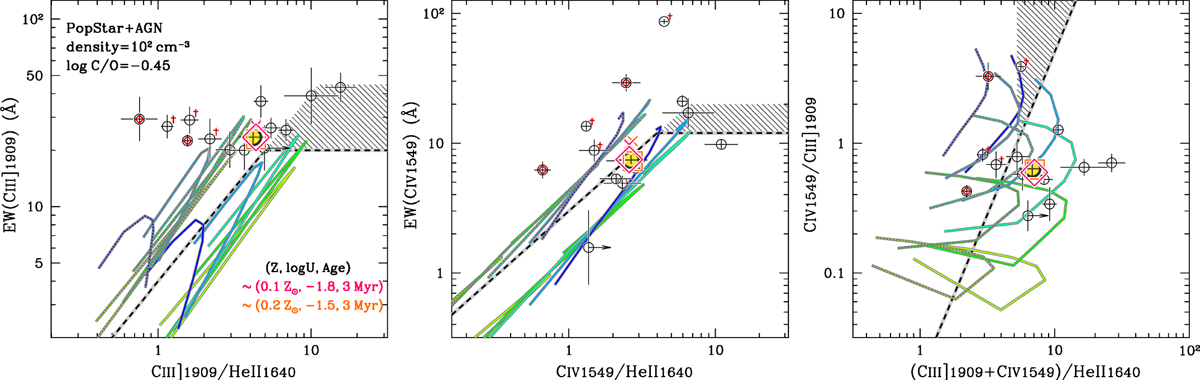
Comparison with the composite of strong [CIII] emitters (Sample A; yellow-filled circle) and the two best fit models (red open diamond and orange open square). The models are provided by the POPSTAR+AGN model with the AGN contribution of fAGN = 0.08, fixing the C/O abundance ratio to log C/O =−0.45. The magenta and orange symbols show the low-Z and high-Z branch solution, respectively, as shown in the legend. The crosses are the same as in Fig. 15. The individual objects in Sample A are also plotted (same symbols as Fig. 14). Objects that are diagnosed to be AGN-powered with the UV diagrams but not X-ray detected are marked with a red dagger.
Current usage metrics show cumulative count of Article Views (full-text article views including HTML views, PDF and ePub downloads, according to the available data) and Abstracts Views on Vision4Press platform.
Data correspond to usage on the plateform after 2015. The current usage metrics is available 48-96 hours after online publication and is updated daily on week days.
Initial download of the metrics may take a while.