Fig. 16
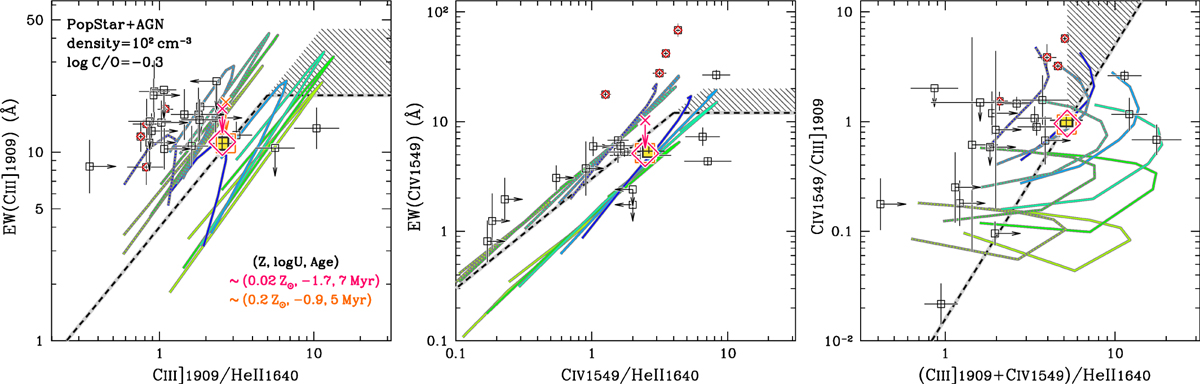
Comparison with the composite of intermediately strong [CIII] emitters (Sample B; yellow-filled square) and the two best-fit models (magenta open diamond and orange open square). The two best fit models are provided by POPSTAR+AGN models with AGN contribution of fAGN = 0.06–0.1, fixing the C/O abundance ratio to the solar value log C/O = −0.3. The magenta symbol corresponds to the low-Z branch solution of Z ~ 0.02 Z⊙, and the orange to the high-Z branch solution of Z ~ 0.2 Z⊙. The crosses are the same as in Fig. 15. The individual objects in Sample B are also plotted (symbols as in Fig. 14).
Current usage metrics show cumulative count of Article Views (full-text article views including HTML views, PDF and ePub downloads, according to the available data) and Abstracts Views on Vision4Press platform.
Data correspond to usage on the plateform after 2015. The current usage metrics is available 48-96 hours after online publication and is updated daily on week days.
Initial download of the metrics may take a while.