Fig. 12
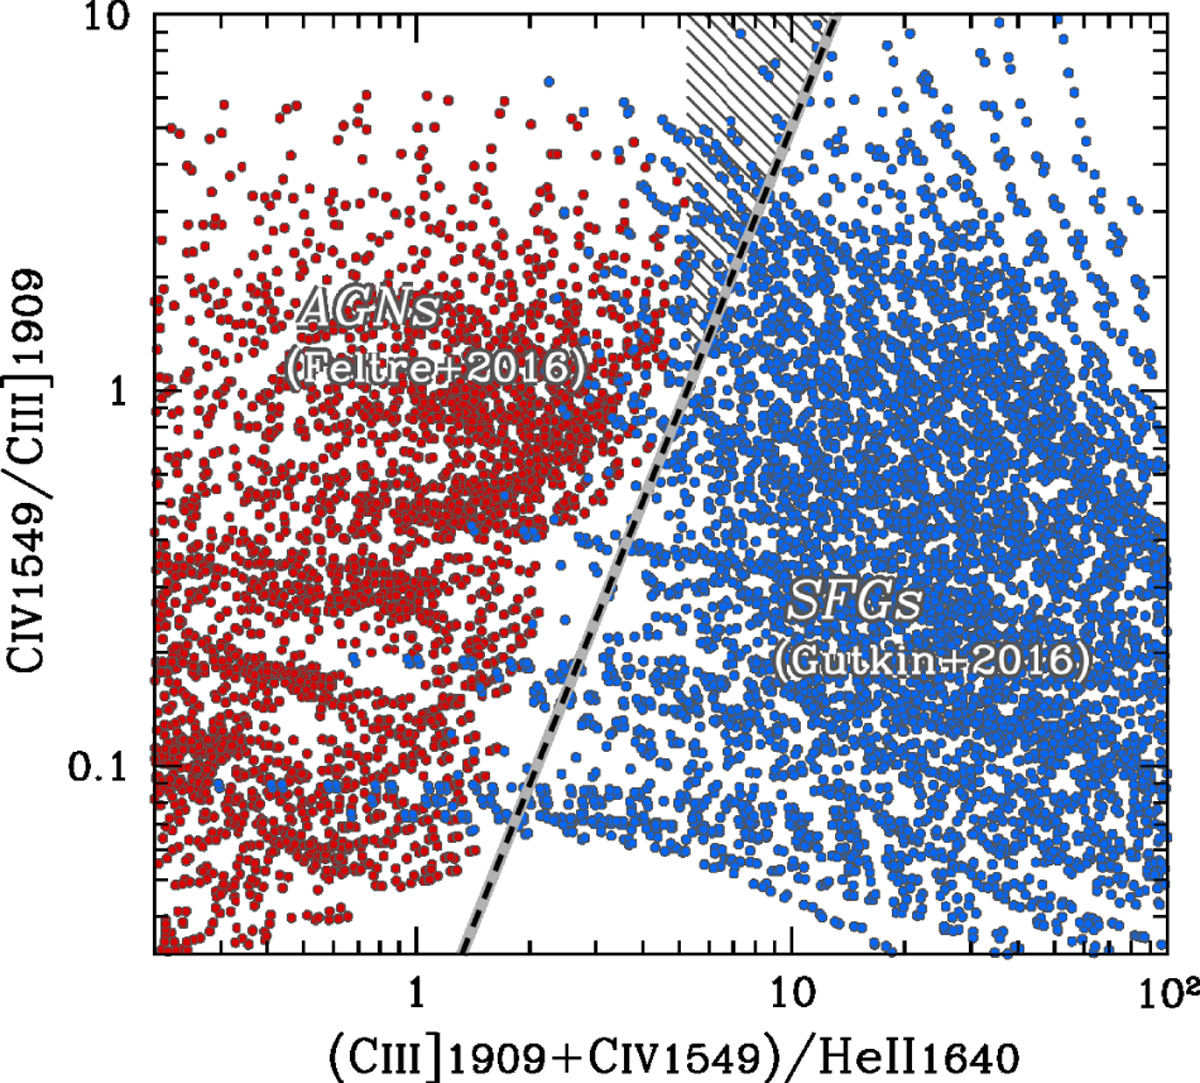
Diagram of C4C3 vs C34 presenting photoionization models of AGNs (red; Feltre et al. 2016) and star-forming galaxies (SFGs; blue; Gutkin et al. 2016). The separating line of Eq. (1) consistently divides the two populations,with a small region where metal-poor, highly ionized galaxy models could contaminate the AGN area (gray shaded) as we also indicate in Fig. 11.
Current usage metrics show cumulative count of Article Views (full-text article views including HTML views, PDF and ePub downloads, according to the available data) and Abstracts Views on Vision4Press platform.
Data correspond to usage on the plateform after 2015. The current usage metrics is available 48-96 hours after online publication and is updated daily on week days.
Initial download of the metrics may take a while.