Fig. 11
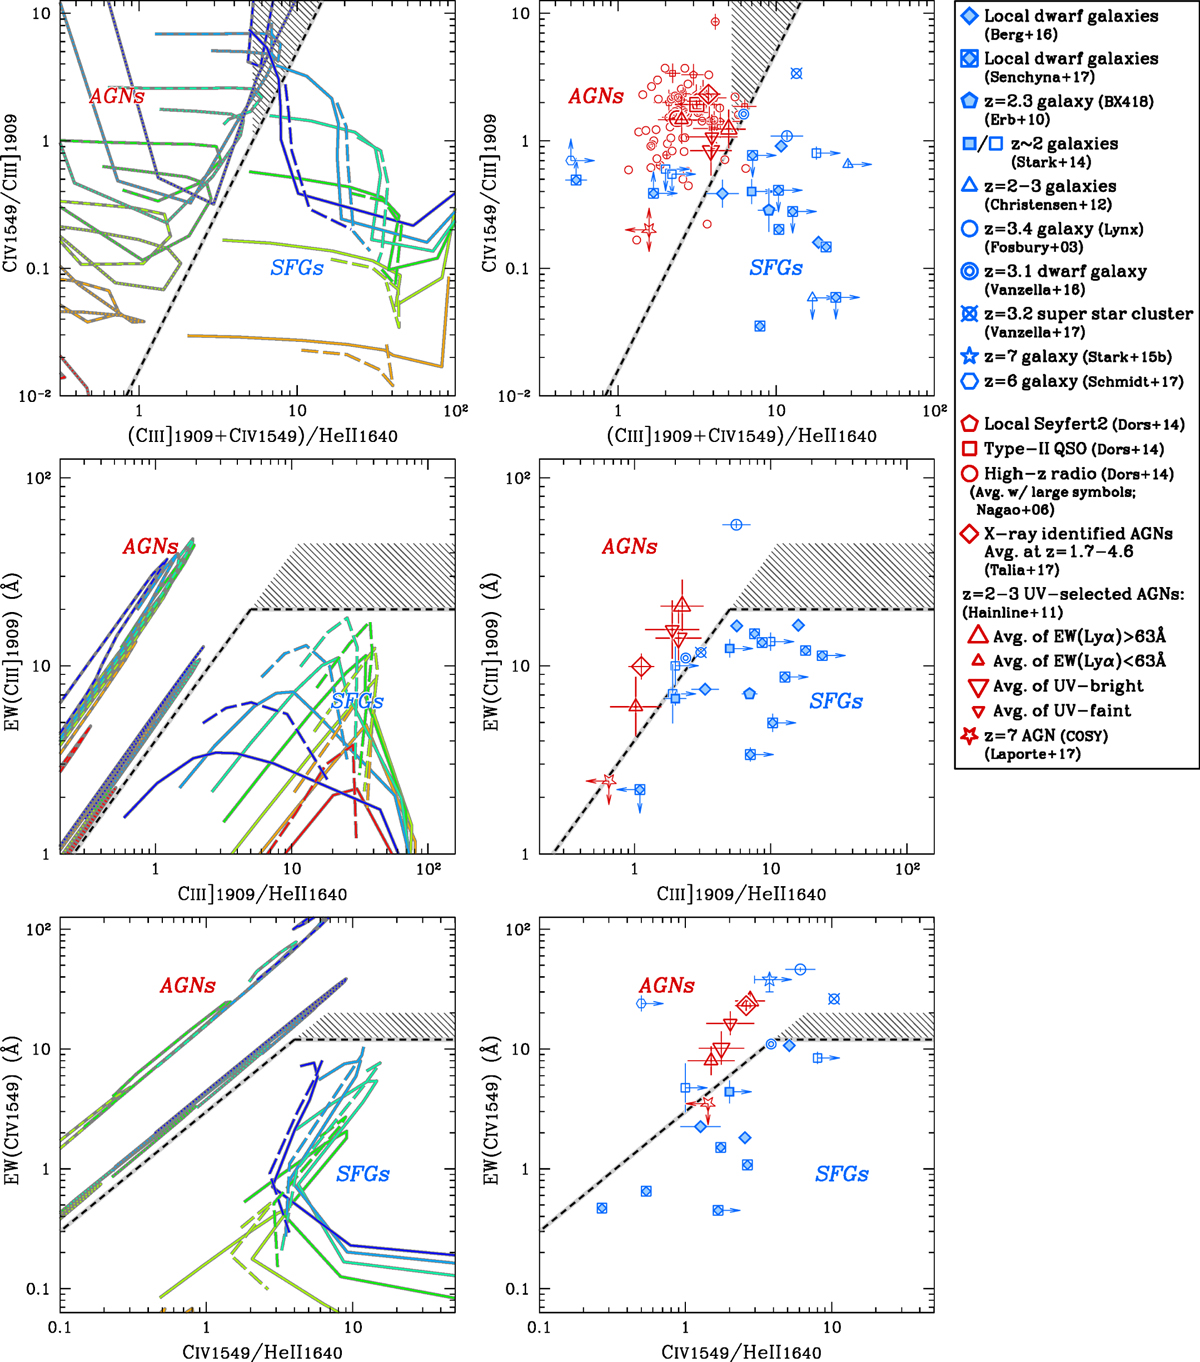
UV diagnostics of star formation and AGN backed up by our photoionization models (left) and observational data compiled from the literature (right). From top to bottom: UV lines diagrams of C4C3 versus C34 (top), EW([CIII]) versus [CIII]/He II ratio (middle), and EW(CIV) versus CIV/He II ratio (bottom) are presented. Left: for star-forming galaxy, the SEDs provided by POPSTAR (solid) and BPASS (long-dashed) are shown. For AGN, two models with different power-law indices of α = −2.0 (dotted) and − 1.2 (dashed) are presented. The same color-scheme is adopted as in Fig. 2. Right: blue and red symbols are star-forminggalaxies and AGNs, respectively, compiled from the literature as shown in the legend. The filled blue symbols present galaxies that are supported to be star-forming according to the optical BPT-diagnostic. The open blue symbols are objects that lack either of the optical BPT-lines but show no sign of AGN. If the EWs and/or the fluxes are below the 2σ detections, we apply the 2σ upper-limitsfor the quantities and denote them with an arrow. The black dashed curves are our proposed separating method of a star-forming galaxy from an AGN (Eqs. (1)–(3)). The gray shaded areas show the regions where both AGN and SF models could overlap, due to a low metallicity (C4C3–C34, top) and a high C/O ratio (EW diagrams; middle and bottom).
Current usage metrics show cumulative count of Article Views (full-text article views including HTML views, PDF and ePub downloads, according to the available data) and Abstracts Views on Vision4Press platform.
Data correspond to usage on the plateform after 2015. The current usage metrics is available 48-96 hours after online publication and is updated daily on week days.
Initial download of the metrics may take a while.