Fig. 12
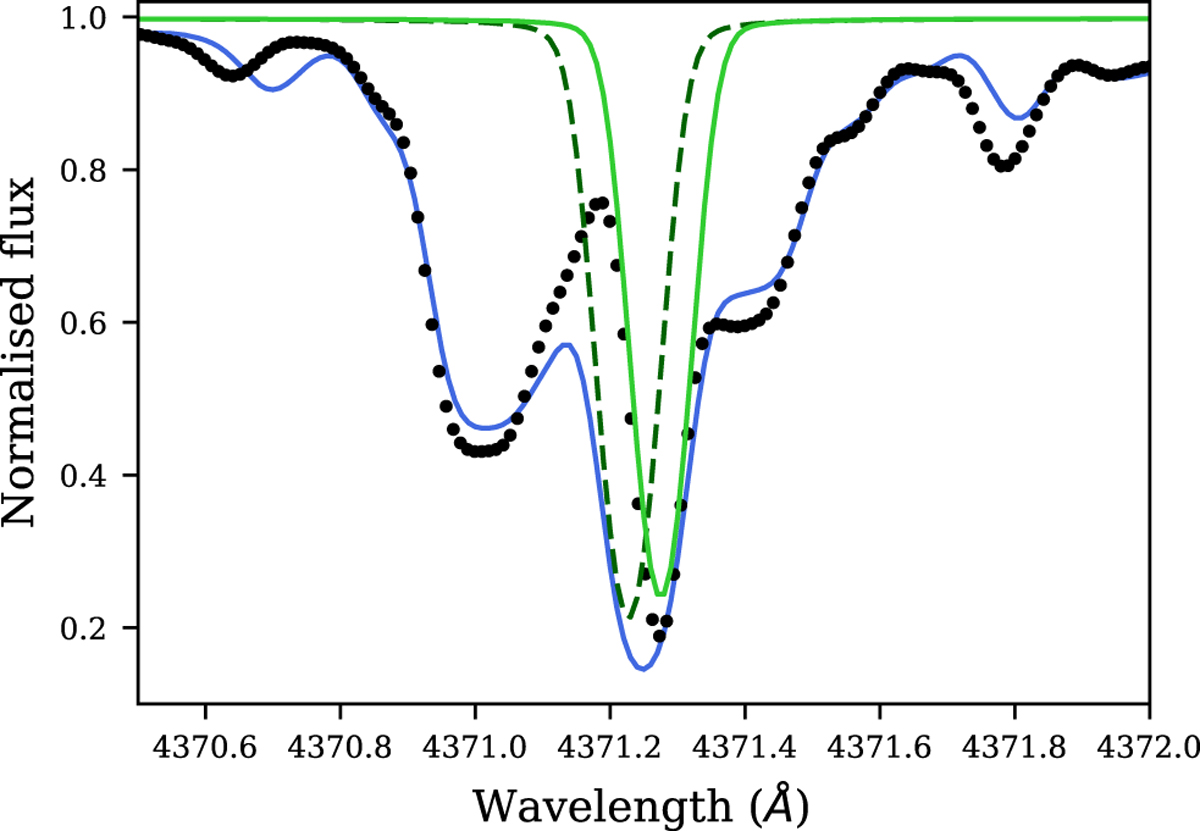
Two Cr I duplicate transitions, introduced during the initial BRASS atomic line list compilation, synthesised for the Sun. The wavelength of the Cr I line shown in dashed green is 4371.23 Å, and the wavelength of the Cr I line in solid green is 4371.28 Å. Shown in black is the FTS solar spectrum described by Neckel & Labs (1984) and shown in blue is a synthetic solar spectrum using the initial BRASS synthesis list including both Cr I lines.
Current usage metrics show cumulative count of Article Views (full-text article views including HTML views, PDF and ePub downloads, according to the available data) and Abstracts Views on Vision4Press platform.
Data correspond to usage on the plateform after 2015. The current usage metrics is available 48-96 hours after online publication and is updated daily on week days.
Initial download of the metrics may take a while.