Fig. 7
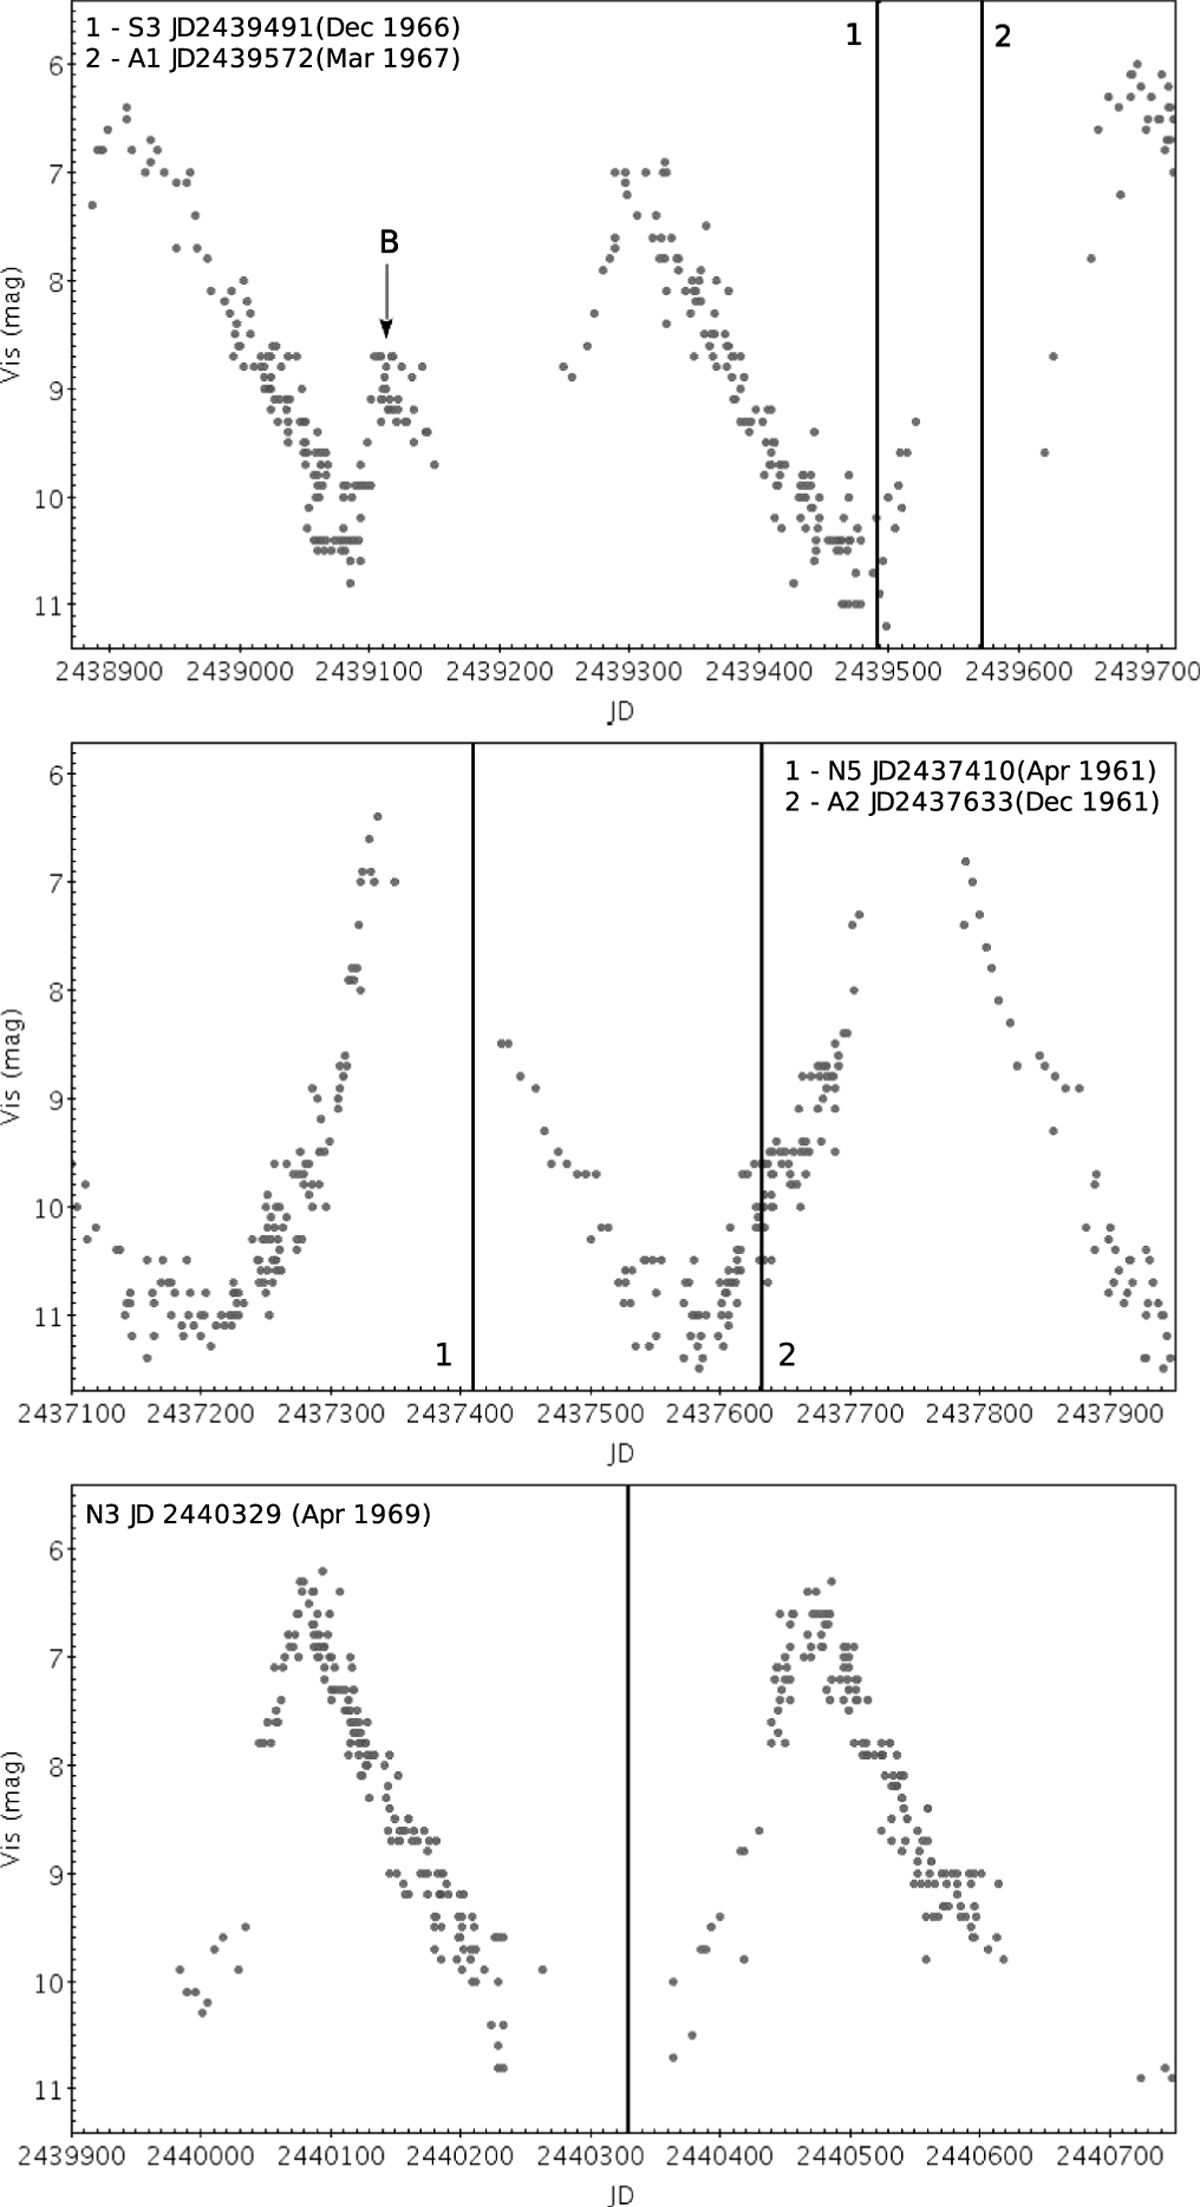
Estimated times of the emission knots ejections. The R Aqr light curve in visual light is taken from the AAVSO data base. The vertical lines mark the estimated ejection epochs of some knots, calculating backwards their kinematical age. The brightening (B), which is breaking the harmonic behaviour, occurred after the minimum of the Mira around JD 2439070 (November 1966) and is marked by an arrow. Within the measurement errors the time of this brightness feature coincides with the extrapolated time of the ejection events of the knots S3 and A1.
Current usage metrics show cumulative count of Article Views (full-text article views including HTML views, PDF and ePub downloads, according to the available data) and Abstracts Views on Vision4Press platform.
Data correspond to usage on the plateform after 2015. The current usage metrics is available 48-96 hours after online publication and is updated daily on week days.
Initial download of the metrics may take a while.