Free Access
Fig. 6
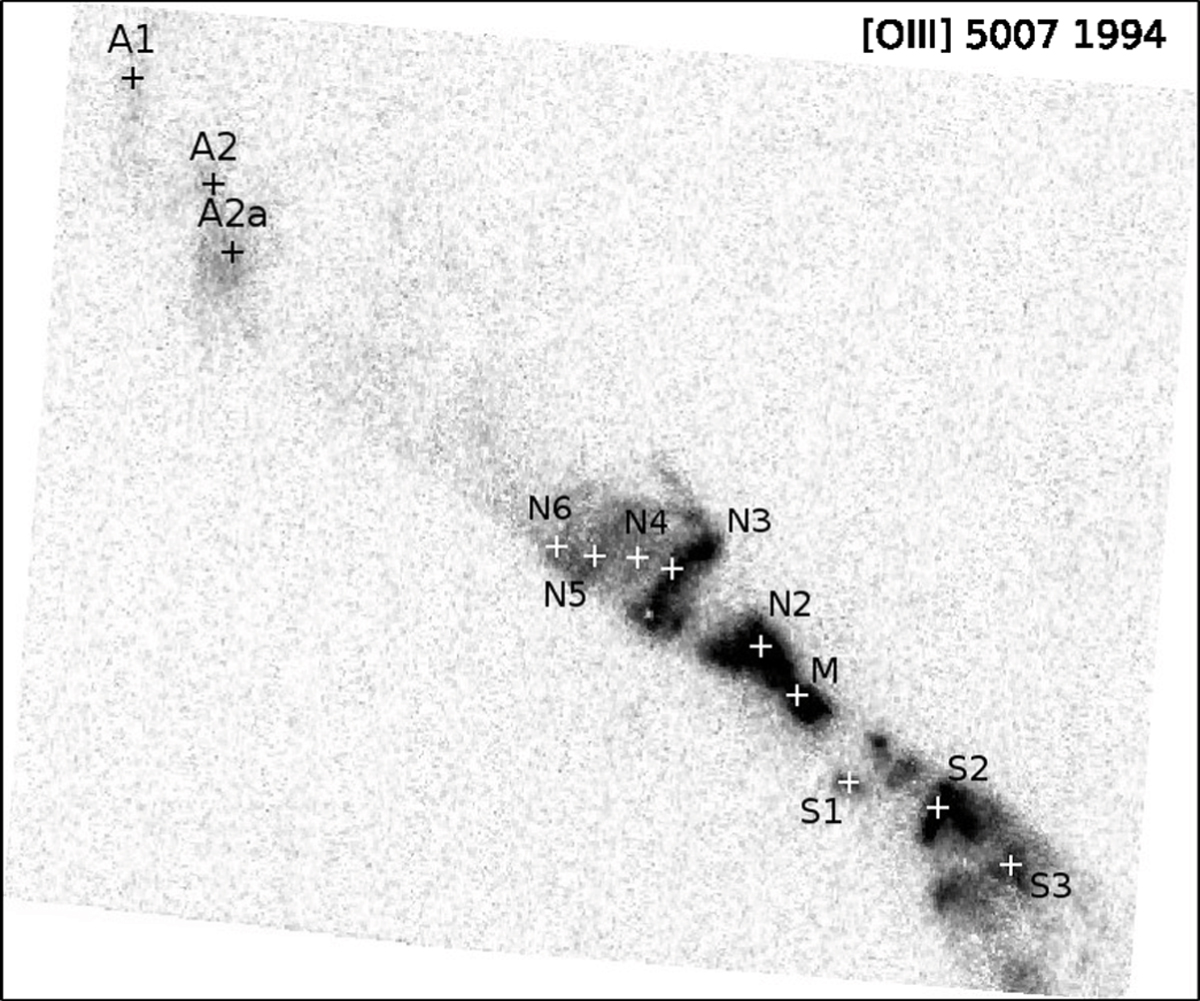
Example of the archival [OIII]λ5007 image (F501N) of the central region of R Aqr obtained in 1994. The identified knots are labelled following Paresce & Hack (1994). After inspection of all archival images, we have identified another knot marked on the image as A2a.
Current usage metrics show cumulative count of Article Views (full-text article views including HTML views, PDF and ePub downloads, according to the available data) and Abstracts Views on Vision4Press platform.
Data correspond to usage on the plateform after 2015. The current usage metrics is available 48-96 hours after online publication and is updated daily on week days.
Initial download of the metrics may take a while.