Fig. 2
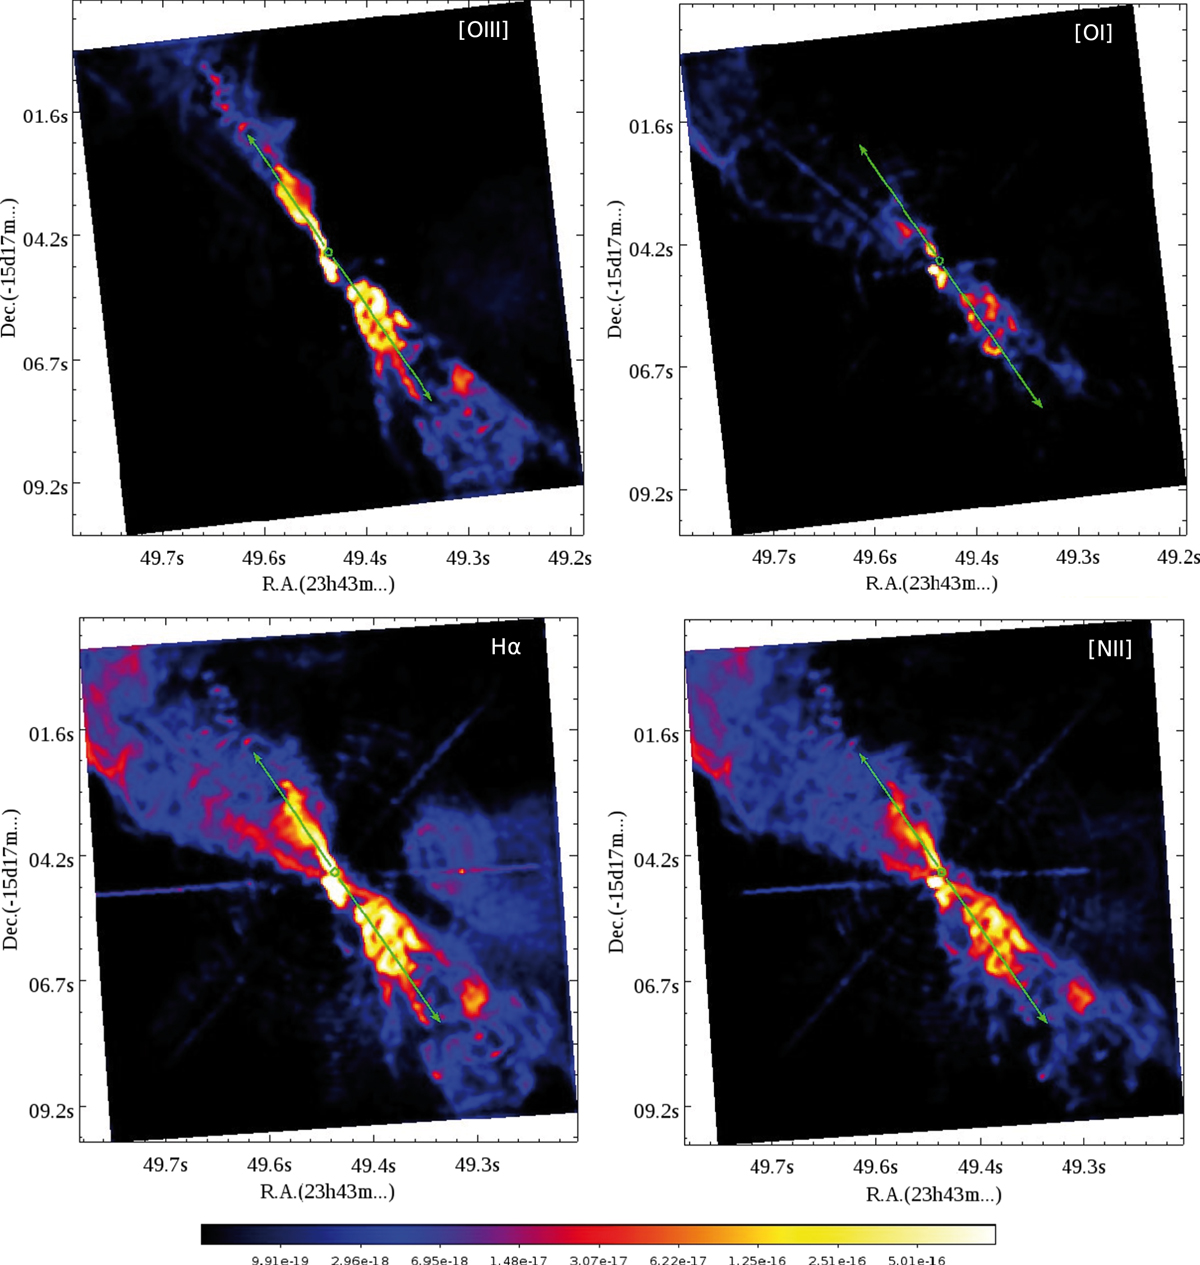
Narrow-band images of the central region with a size of 10′′× 10′′ (filters given on the top left of each map). A PSF pattern has been subtracted. The colour scale for the fluxes ranges from 0 to 10−15 erg cm−2 s−1 Å−1. The adopted axis of the jet (green lines with arrows) was aligned according to a helical structure visible extended in NE direction on the [OIII]λ5007 emission map; this structure probably represents a high-collimated jet. The jet base position (green circle) drawn from the adopted jet axis does not coincide with the position of the stellar components resolved in Schmid et al. (2017).
Current usage metrics show cumulative count of Article Views (full-text article views including HTML views, PDF and ePub downloads, according to the available data) and Abstracts Views on Vision4Press platform.
Data correspond to usage on the plateform after 2015. The current usage metrics is available 48-96 hours after online publication and is updated daily on week days.
Initial download of the metrics may take a while.