Fig. 1
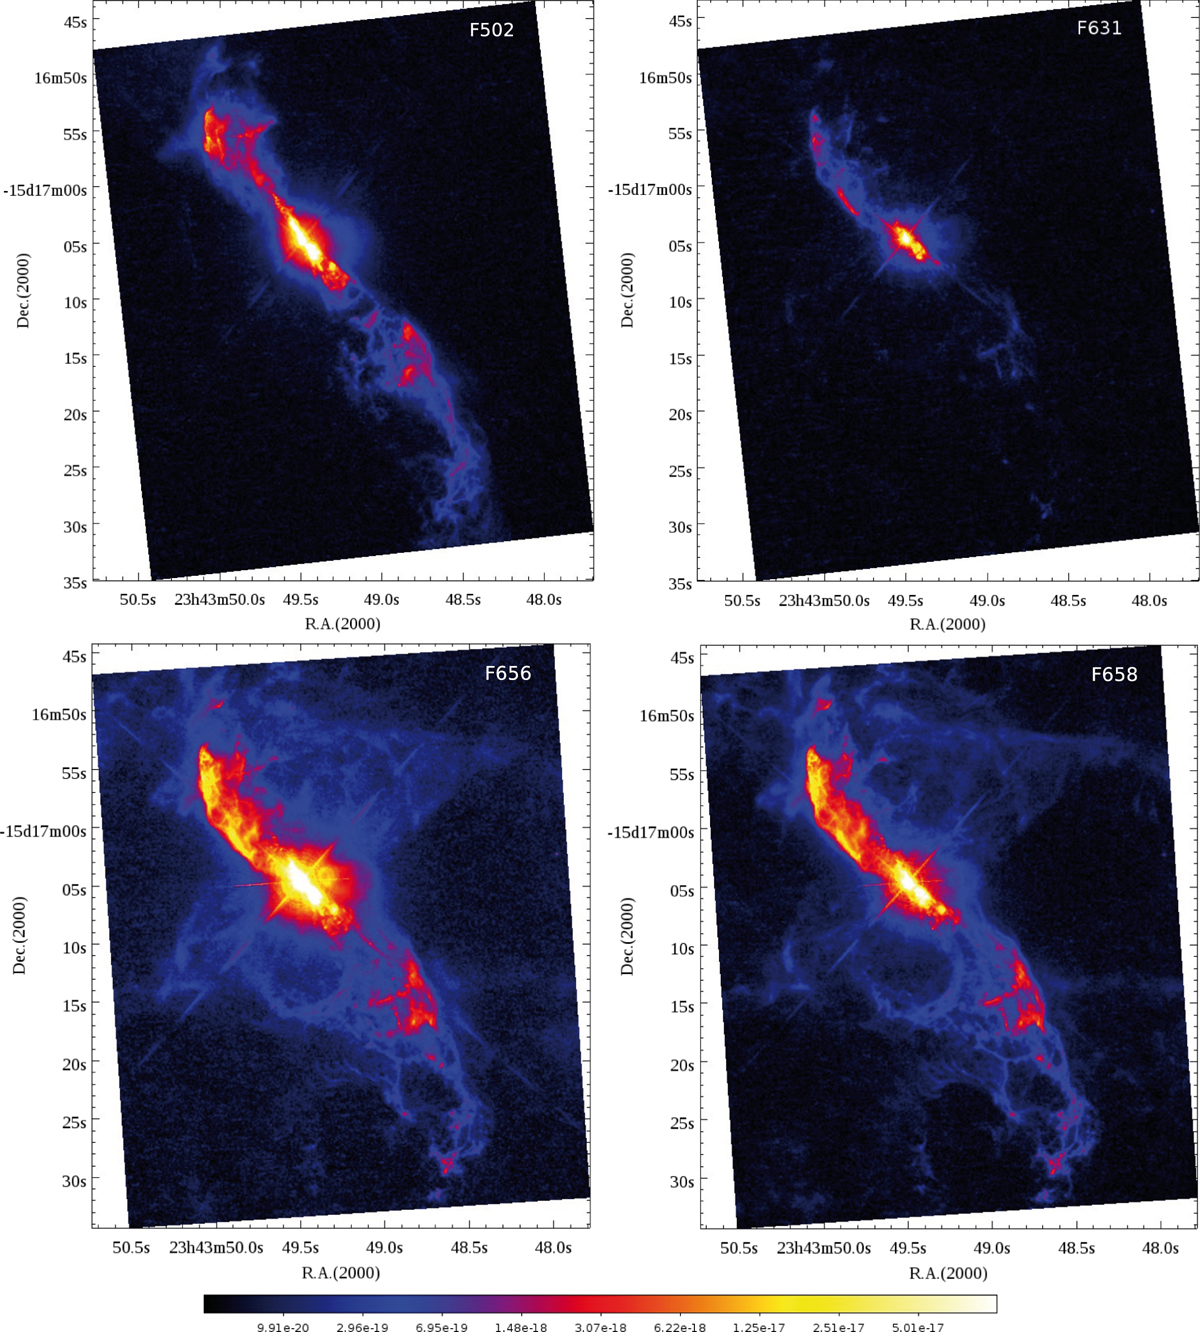
Large-scale HST images (~45′′× 45′′) taken through filters F502N ([O III] λ 5007), F631N ([OI] λ 6300) during the 2013 observing run and the filters F656N (Hα) and F658N ([NII] λ 6583) obtained in 2014. The colour scale for the fluxes ranges from 0 to 10−16 erg cm−2 s−1 Å−1. The Hα map contains a roundish emission spot (~2–3′′ to the west of the central source) which is probably an “image ghost” (see also Fig. 2).
Current usage metrics show cumulative count of Article Views (full-text article views including HTML views, PDF and ePub downloads, according to the available data) and Abstracts Views on Vision4Press platform.
Data correspond to usage on the plateform after 2015. The current usage metrics is available 48-96 hours after online publication and is updated daily on week days.
Initial download of the metrics may take a while.